Category: Metrics and performance indicators

  • Exporting reports

    This guide explains how to export report data, download subscriber lists, and extract campaign activity data from Sender in usable file formats.

    Where to find this feature

    Sender provides export options from several locations across the platform. Each location targets a different type of data:

    Dashboard → Click Export in the top-right corner to generate a PDF overview report containing your selected dashboard sections.

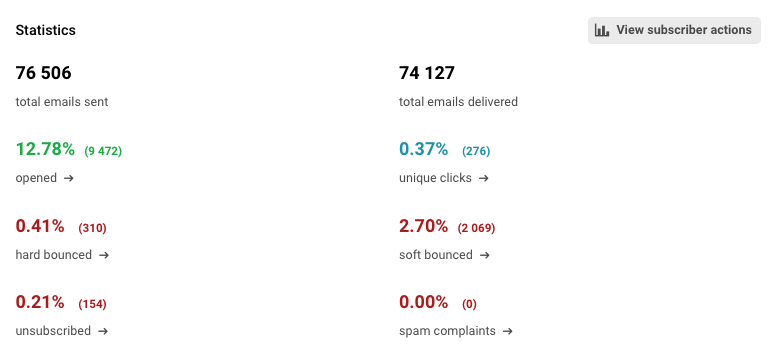
    Email campaigns → Open a sent campaign's report, go to Subscriber actions, and select an activity tab (such as Opens, Clicks, or Hard bounces). Click Export on the Subscriber actions page to download the event-level data.

    Subscribers → Go to Subscribers, select subscribers using the checkbox column, then open the Actions dropdown to access Export to CSV or Export to XLSX.

    Transactional emails → Open a transactional email's report, go to Activity, and select an event tab (such as Sent, Opens, or Bounces). Click Export on the Transactional email activity page to download the data.

    Steps to export report data

    Step 1 — Choose the data source and filter your results

    Navigate to the page that contains the data you want to export. For campaign activity, open the sent campaign's report and select a tab under Subscriber actions — such as Opens, Clicks, Hard bounces, Soft bounces, Unsubscribes, Spam reports, Unopens, or Purchases. For subscriber lists, go to Subscribers and narrow results using the Email status, SMS status, and Groups filters, or click Advanced filter to build conditions based on group membership, created date, location, or campaign activity.

    Step 2 — Select the records and export format

    For subscriber exports, click the checkbox in the header row and choose Select visible or Select all. Open the Actions dropdown and click Export to CSV or Export to XLSX. The file downloads immediately containing all selected subscriber records with their profile fields.

    For campaign or transactional activity exports, use the Find subscriber by email search bar to narrow results if needed, then click Export in the top-right corner of the Subscriber actions or Transactional email activity page. You can also click Print to generate a printable version of the data.

    Step 3 — Export the dashboard overview as PDF

    On the Dashboard, click Export in the top-right corner. In the Export Overview report dialog, enter a name in the Report name field and select the data sections to include — Sale performance, Best performing emails, Traffic and reach report, and Subscribers growth — by clicking each section to toggle it on or off. Click Export PDF to download the report. The exported PDF reflects the date range currently set on the dashboard.

    Step 4 — Print individual campaign or transactional reports

    On the Campaign overview or Transactional email report page, click Print report in the top-right corner. This generates a printable version of the full report including statistics, charts, and ecommerce data. Use your browser's print dialog to save the output as a PDF file if needed.

    What the export contains

    Subscriber list exports (CSV/XLSX) include all profile fields visible in the subscriber table. The standard columns are described below.

    Email — The subscriber's email address.

    First name — The subscriber's first name, if provided.

    Last name — The subscriber's last name, if provided.

    Phone number — The subscriber's phone number, if added.

    Status — The subscriber's current subscription status for email and SMS channels (such as Active, Bounced, Unsubscribed, or Non-subscribed).

    Groups — The groups the subscriber belongs to.

    Location — The subscriber's geographic location, if available.

    Date added — The date and time the subscriber was added to Sender.

    Custom fields — Any custom fields configured in your account (such as Birthday) are included as additional columns.

    Campaign and transactional activity exports contain event-level data for the selected action tab. The standard columns are described below.

    Email address — The subscriber's email address that triggered the event.

    Date / time — The timestamp of the event (such as the open, click, or bounce occurrence).

    Dashboard overview PDF exports include the dashboard sections you selected — traffic and reach metrics, subscriber growth charts, best-performing emails, and sale performance data for the selected date range.

    How attribution works

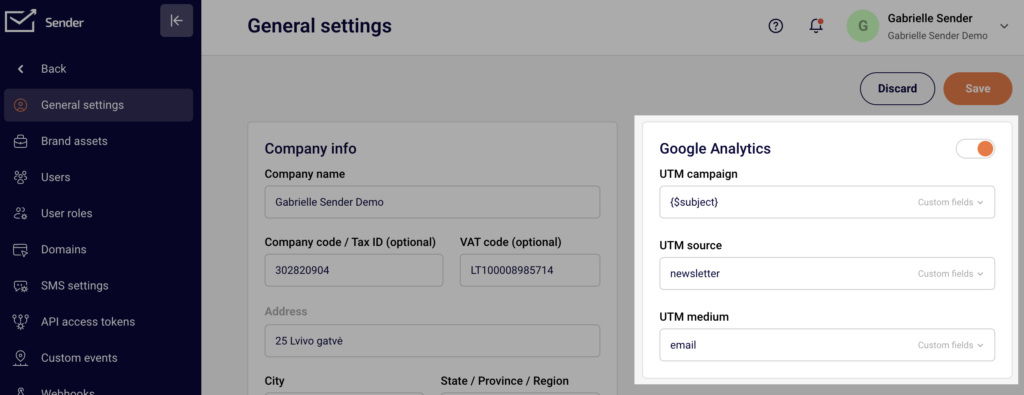
    Google Analytics campaign name — Sender automatically assigns a Google Analytics campaign name to each sent campaign. This value appears in the Appears on Google Analytics as field on the Campaign overview page. Sender uses this name as the utm_campaign parameter when appending UTM tags to your email links, allowing you to track campaign-driven traffic in Google Analytics.

    Event-to-campaign attribution — Sender attributes each open, click, bounce, unsubscribe, and spam report to the specific campaign or transactional email that triggered it. When a subscriber opens or clicks a link in an email, the event is recorded against that campaign on the Subscriber actions page. Each event includes the subscriber's email address and the exact timestamp.

    Subscriber activity log — The Subscriber's profile page shows a chronological Subscriber activity log that records all events tied to that contact, including sends, opens, bounces, group changes, and field updates. Each entry references the specific campaign or action and can be filtered by activity type using the Filter activity dropdown.

    UTM parameters for external tracking — To track email-driven traffic in external analytics tools, add UTM parameters directly to your link URLs in the email editor (for example, ?utm_source=sender&utm_medium=email&utm_campaign=spring_sale). These parameters pass through to your analytics tool when a subscriber clicks the link. Sender's built-in Google Analytics campaign name covers the utm_campaign value automatically, but you can customize all UTM parameters on individual links for more granular tracking.

    Export tips

    Filter before exporting — Apply Email status, Groups, or Advanced filter conditions on the Subscribers page before selecting and exporting. Only the filtered results are included in the export file, which keeps file sizes manageable and data relevant.

    Use Advanced filter for precise segments — The Advanced filter on the Subscribers page lets you build conditions based on subscription status, group membership, email address, created date, subscriber location, campaign activity (opened, clicked, unsubscribed, was inactive), and custom fields. Combine multiple conditions to isolate the exact subscriber segment you need before exporting.

    Choose the right format — Use Export to CSV for compatibility with most tools including Google Sheets, Excel, and BI platforms. Use Export to XLSX if you need native Excel formatting or plan to work primarily in Excel.

    Export activity by event type — On the Subscriber actions page, switch between tabs like Opens, Clicks, and Hard bounces before clicking Export. Each tab exports only the subscribers who triggered that specific event, so you can create separate files for each activity type.

    Save dashboard reports regularly — Use the Export button on the Dashboard to generate named PDF snapshots of your performance data. Adjust the date range before exporting to capture weekly, monthly, or custom reporting periods.

    Common issues

    Export file is empty or contains no records → The selected event tab has no data for that campaign or time period. Switch to a different tab under Subscriber actions or verify that the campaign was sent and has recorded activity.

    Subscriber export has fewer records than expected → Active filters on the Subscribers page are limiting results. Check the Email status, SMS status, and Groups filters, and close the Advanced filter panel if conditions are set. Clear all filters and re-select subscribers to export the full list.

    Custom fields are missing from the export → Custom fields are included in subscriber list exports automatically. If a field column appears empty, the data has not been populated for those subscribers. Verify that the field exists under Subscribers → Fields and that subscribers have values assigned.

    Dashboard PDF does not include all sections → In the Export Overview report dialog, ensure all desired data sections are toggled on. Sections that are not selected (shown without a minus icon) are excluded from the PDF.

    Campaign report has no Export button on the overview page → The Export button appears on the Subscriber actions page, not on the campaign Overview tab. Click View subscriber actions or select a tab under Subscriber actions in the left sidebar to access the export function.

    FAQs

    What file formats are available for exports?

    Subscriber list exports are available in CSV and XLSX formats. Dashboard overview exports download as PDF files. Campaign and transactional activity exports use the Export button on the Subscriber actions or Transactional email activity page.

    Can I filter subscribers before exporting?

    Yes. On the Subscribers page, use the Email status, SMS status, and Groups dropdown filters to narrow the list. For more precise filtering, click Advanced filter to build conditions based on group membership, email address, created date, location, campaign activity, or custom fields. Only the filtered results are included when you export.

    How does Sender attribute a click to a specific campaign?

    Sender attributes a click to the campaign that contained the tracked link. When a subscriber clicks a link in an email, the event is recorded against that specific campaign on the Subscriber actions page with the subscriber's email and timestamp. If the subscriber received multiple campaigns, each click is attributed to the campaign that generated the link.

    Can I add UTM parameters to my email links?

    Yes. When editing an email, add UTM parameters directly to your link URLs (for example, ?utm_source=sender&utm_medium=email&utm_campaign=summer_sale). These parameters pass through to your external analytics tool when a subscriber clicks the link. Sender also sets a Google Analytics campaign name automatically, which appears in the Appears on Google Analytics as field on the campaign report.

    How do I export data for a GDPR data subject request?

    Go to Subscribers, search for the subscriber by email address, and open their profile. The Subscriber's profile page displays all stored data including email, name, location, groups, source, and the full Subscriber activity log. Export the subscriber's record from the Subscribers list using Export to CSV or Export to XLSX, and reference the profile page for activity history. You can then delete the subscriber record using the Actions → Delete option on the profile page to fulfill a deletion request.

    Can I export automation workflow report data?

    Automation performance statistics (emails sent, opens, clicks) are displayed on the Automations list page. Individual automation email steps share the same report structure as campaign reports — open the automation, navigate to an email step's report, and use the Subscriber actions export to download event-level data for that step.

    What does the Appears on Google Analytics as field mean?

    This field on the Campaign overview page shows the campaign name that Sender passes to Google Analytics as the utm_campaign value. It allows you to identify email-driven traffic from that specific campaign in your Google Analytics reports.

  • Attribution basics

    This guide explains how Sender attributes email events to specific campaigns, how Google Analytics tracking works with your sends, and where to find attribution-related data across your account.

    Where to find this feature

    Attribution data in Sender is not located on a single page. It surfaces across several areas of the dashboard.

    On the Campaign overview page, open any sent campaign from Email campaigns and click the report icon. The Settings section displays the Appears on Google Analytics as value, which shows the campaign name passed to Google Analytics through UTM parameters. The Statistics section shows event counts attributed to that campaign, including opened, unique clicks, hard bounced, soft bounced, unsubscribed, and spam reports. Click View subscriber actions to see individual subscriber-level events attributed to the campaign.

    On the General settings page, go to Account settings → General settings. The Google Analytics section on the right side of the page controls the default UTM parameters appended to all campaign links. This is where you configure how Sender identifies your email traffic in external analytics tools.

    On the Subscriber's profile page, open any subscriber from the Subscribers list. The Subscriber activity panel on the right displays a timestamped log of all events attributed to that subscriber, including sends, bounces, opens, clicks, and group changes, each linked to the specific campaign that triggered the event.

    Steps to understand and configure attribution

    Step 1 — Review campaign-level attribution

    Open a sent campaign from Email campaigns and click the report icon to reach the Campaign overview page. The Statistics section shows aggregated events attributed to that campaign: total emails sent, total emails delivered, opened, unique clicks, hard bounced, soft bounced, unsubscribed, and spam reports. Each event is attributed directly to this specific campaign send. Click View subscriber actions to open the Subscriber actions page, where events are broken out into tabs: Opens, Clicks, Hard bounces, Soft bounces, Unsubscribes, Spam reports, Unopens, and Purchases.

    Step 2 — Configure Google Analytics UTM parameters

    Go to Account settings → General settings. On the right side, locate the Google Analytics section. Confirm the toggle is enabled (orange). Set the three UTM fields that Sender appends to every tracked link in your campaigns:

    UTM campaign — Defaults to {$subject}, which dynamically inserts the email subject line. You can replace this with a static value or use Custom fields from the dropdown.

    UTM source — Defaults to newsletter. Change this to match your naming convention in Google Analytics.

    UTM medium — Defaults to email. This value identifies the traffic channel in your external analytics tool.

    Click Save to apply. These values apply account-wide to all future campaign sends.

    Step 3 — Verify attribution on the review page

    Before sending a campaign, navigate to the Review and send step in the campaign editor. Under Settings, check the Appears on Google Analytics as field. This confirms the campaign name that will be passed as the utm_campaign value. If you set a custom campaign name in the Settings step using the Set custom campaign name button, that name appears here instead of the email subject.

    Step 4 — View subscriber-level attribution

    Go to Subscribers, find a subscriber, and click the arrow to open their Subscriber's profile. The Subscriber activity panel shows a chronological log of all events attributed to that subscriber. Each entry displays the date, time, event type (sent, bounced, opened, clicked, added to group), and the specific campaign or source responsible. Use the Filter activity dropdown to narrow the log to specific event types.

    What the export contains

    Attribution data is embedded in several export types across Sender. The subscriber actions view and campaign reports display attributed events, while the subscriber export and dashboard export provide supporting profile and performance data.

    Email address — The subscriber's email address associated with each attributed event.

    First Name — The subscriber's first name, as stored in the profile.

    Last Name — The subscriber's last name, as stored in the profile.

    Date / time — The timestamp of the event, shown in your account's time zone.

    Event type — The specific action attributed to the campaign, such as opened, clicked, bounced, unsubscribed, or reported spam. Visible on the Subscriber actions page under each tab.

    Campaign name — The campaign to which the event is attributed. Visible in the Subscriber activity log and on the Campaign overview page.

    Appears on Google Analytics as — The UTM campaign value associated with the send, shown on the Campaign overview and Review and send pages. The exported PDF from the dashboard Export button includes this alongside performance metrics.

    How attribution works

    Campaign-level attribution — Sender attributes every open, click, bounce, unsubscribe, and spam report to the specific campaign that generated the event. When a subscriber opens an email or clicks a link, that action is recorded against the campaign that contained the tracked content. Each event maps to exactly one campaign send.

    Subscriber actions attribution — On the Subscriber actions page, events are grouped by type under tabs such as Opens, Clicks, Hard bounces, Soft bounces, Unsubscribes, Spam reports, Unopens, and Purchases. Each record lists the subscriber's email address and the date/time the event occurred, all attributed to the campaign you are viewing.

    Google Analytics UTM attribution — When the Google Analytics toggle is enabled in General settings, Sender automatically appends utm_source, utm_medium, and utm_campaign parameters to every tracked link in your emails. The default values are utm_source=newsletter, utm_medium=email, and utm_campaign={$subject} (the email subject line). These parameters allow Google Analytics and other external tools to attribute website traffic and conversions to specific email campaigns.

    Custom campaign name attribution — By default, the UTM campaign value uses the {$subject} variable, which inserts the email subject. You can override this per campaign by clicking Set custom campaign name on the Campaign settings page when editing a campaign. The custom name then appears in the Appears on Google Analytics as field on the Review and send page and in Google Analytics reports.

    Ecommerce attribution — The Campaign overview page includes an Ecommerce section that shows Total revenue, Number of orders, Revenue per customer, and ROI attributed to a campaign. This requires enabling Enable ecommerce tracking (available on Pro plans) in General settings and installing an ecommerce integration via the Connected stores page.

    Export tips

    Use the dashboard Export for a summary PDF — Click Export on the Dashboard page to generate a PDF report. Name the report, select data categories such as Sale performance, Best performing emails, Traffic and reach report, and Subscribers growth, then click Export PDF.

    Print campaign reports for offline review — On the Campaign overview page, click Print report to generate a printable version of the campaign's attribution data, including statistics, charts, and settings.

    Filter subscribers before exporting — On the Subscribers page, use the Email status, SMS status, Groups, and Advanced filter options to narrow the list before selecting and exporting. Only filtered results are included in the exported CSV or XLSX file.

    Set consistent UTM naming conventions — Define a clear naming pattern for your UTM source, UTM medium, and UTM campaign values in General settings before sending campaigns. Consistent naming makes it easier to filter and compare email campaign performance in Google Analytics.

    Check the Review page before every send — Always verify the Appears on Google Analytics as value on the Review and send step to confirm the correct campaign name will be passed to your external analytics tool.

    Common issues

    UTM parameters not appearing in Google Analytics → The Google Analytics toggle may be disabled. Go to Account settings → General settings and confirm the toggle in the Google Analytics section is enabled (orange). Save your settings and send a test email to verify.

    Campaign name shows the subject line instead of a custom name → The UTM campaign field in General settings defaults to {$subject}. To use a custom name for a specific campaign, click Set custom campaign name on the Campaign settings page when editing the campaign and enter your preferred name.

    Subscriber activity log shows no events → The subscriber may not have been included in any sent campaigns. Check that the campaign was sent and the subscriber was in the recipient list. Use the Filter activity dropdown on the Subscriber's profile page to confirm the event type you are looking for.

    Opens or clicks show 0% on the campaign overview → If the email hard bounced for all recipients, no opens or clicks will be recorded. Check the hard bounced and soft bounced counts in the Statistics section. A 100% hard bounce rate means no emails were delivered, so no engagement events can be attributed.

    Ecommerce data not appearing on campaign reports → Ecommerce attribution requires the Enable ecommerce tracking toggle in General settings (available on Pro plans) and an active integration via Connected stores. Click Install integration and track your sales performance on the Campaign overview page to set up the connection.

    FAQs

    How does Sender attribute a click to a specific campaign?

    Sender attributes a click to the campaign that contained the tracked link. When a subscriber clicks a link in an email, the event is recorded against that specific campaign. If the subscriber received multiple campaigns, each click is attributed to the campaign that generated the link the subscriber clicked.

    What UTM parameters does Sender add automatically?

    When the Google Analytics toggle is enabled in General settings, Sender appends three UTM parameters to all tracked links: utm_source (default: newsletter), utm_medium (default: email), and utm_campaign (default: {$subject}, which inserts the email subject line). You can customize all three values in the Google Analytics section of General settings.

    Can I use a custom UTM campaign value for a single campaign?

    Yes. On the Campaign settings page when editing a campaign, click Set custom campaign name and enter your preferred value. This overrides the account-wide {$subject} default for that specific campaign. The custom name appears in the Appears on Google Analytics as field on the Review and send page.

    Where can I see all events attributed to a single subscriber?

    Go to Subscribers, find the subscriber, and click the arrow to open their Subscriber's profile. The Subscriber activity panel on the right displays a timestamped log of all events, including sends, bounces, opens, clicks, and group changes. Use the Filter activity dropdown to narrow by event type.

    Does Sender support multi-touch attribution?

    Sender uses single-touch, campaign-level attribution. Each open, click, or other event is attributed to the one campaign that generated it. There is no built-in multi-touch attribution model that distributes credit across multiple campaigns. To analyze multi-touch journeys, export your data and use an external analytics or BI tool.

    What does the Appears on Google Analytics as field show?

    This field on the Campaign overview and Review and send pages displays the value that Sender passes as the utm_campaign parameter for that campaign. By default, this is the email subject line. If you set a custom campaign name, that value appears instead.

  • Understanding Bounces and Complaints

    This guide explains bounce and spam complaint metrics in Sender — what they measure, how they are calculated, and how to interpret them to protect your sender reputation.

    What These Metrics Measure

    Bounce metrics track emails that were rejected by the recipient's mail server and never reached the inbox. Sender separates bounces into two types: hard bounces (permanent delivery failures) and soft bounces (temporary delivery failures). Spam complaint metrics track instances where recipients mark your email as spam or junk through their email client. Together, these metrics are critical indicators of list health, sending reputation, and long-term deliverability.

    Metric Definitions

    Hard bounce rate — The percentage of sent emails that permanently failed to deliver. Calculated as the number of hard bounces divided by total emails sent, expressed as a percentage. Displayed on the Dashboard within the Traffic and reach report and on the Campaign overview under Statistics as hard bounced.

    Soft bounce rate — The percentage of sent emails that temporarily failed to deliver. Calculated as the number of soft bounces divided by total emails sent, expressed as a percentage. Displayed on the Dashboard within the Traffic and reach report and on the Campaign overview under Statistics as soft bounced.

    Bounce rate — The combined percentage of all bounced emails (hard and soft) relative to total emails sent. Displayed on the Dashboard within the Traffic and reach report as a single aggregate percentage.

    Total bounces — The raw count of all bounced emails (hard and soft combined) within the selected date range. Displayed on the Dashboard within the Traffic and reach report as an absolute number.

    Total spams — The raw count of spam complaints received within the selected date range. Displayed on the Dashboard within the Traffic and reach report as an absolute number.

    Average spam rate — The percentage of sent emails that generated spam complaints, averaged across campaigns in the selected date range. Displayed on the Dashboard within the Traffic and reach report as a percentage.

    Spam reports — The per-campaign count and percentage of recipients who reported the email as spam. Displayed on the Campaign overview under Statistics and accessible as a detailed subscriber list under Subscriber actions → Spam reports.

    How to Interpret the Data

    Hard bounce rate below 0.5% — Indicates a clean, well-maintained list with valid email addresses. No immediate action is needed, but continue practicing routine list hygiene.

    Hard bounce rate between 0.5% and 2% — Suggests that a portion of your list contains invalid or outdated addresses. Review recently added subscribers and check for data-entry errors, expired domains, or inactive accounts.

    Hard bounce rate above 2% — Signals a serious list quality problem that can damage your sender reputation. Investigate the source of these addresses and remove or suppress hard-bounced contacts immediately.

    Soft bounce rate below 2% — Within normal range. Soft bounces are typically caused by temporary conditions such as full inboxes or server downtime, and often resolve on their own.

    Soft bounce rate between 2% and 5% — May indicate recurring delivery issues with certain mailbox providers or that some recipients' inboxes are consistently full. Monitor whether the same addresses soft-bounce repeatedly across campaigns.

    Soft bounce rate above 5% — Warrants investigation. Persistent soft bounces to the same addresses may eventually be treated as hard bounces by mailbox providers, and a high soft bounce rate can signal infrastructure or content-related filtering.

    Spam complaint rate below 0.1% — Generally considered acceptable by most mailbox providers. This is the threshold many providers use to evaluate sender reputation, so staying well below it is important.

    Spam complaint rate between 0.1% and 0.3% — A warning range. Some mailbox providers may begin throttling or filtering your emails. Review your content, sending frequency, and whether recipients clearly opted in.

    Spam complaint rate above 0.3% — Critical. Sustained rates at this level can trigger inbox placement penalties, domain reputation damage, or sending restrictions. Immediate action is needed to identify the cause.

    Note that all of these thresholds are general references. Acceptable ranges vary by industry, audience size, and mailbox provider tolerance levels.

    How Metrics Relate to Each Other

    Hard bounces and delivery rate — Every hard bounce is an email that was never delivered. A rising hard bounce rate directly reduces your delivery rate and indicates addresses that should be removed from your list to avoid compounding reputation damage.

    Soft bounces and hard bounces — Repeated soft bounces to the same address across multiple campaigns may eventually be reclassified as hard bounces by the receiving mail server. Monitoring both metrics together helps you identify contacts that are persistently unreachable.

    Bounce rate and spam complaint rate — Both metrics feed into your sender reputation as assessed by mailbox providers. High bounces suggest poor list quality, while high complaints suggest recipients did not want the email. When both are elevated simultaneously, the reputation impact is compounded.

    Spam complaints and open rate — A spike in spam complaints often correlates with changes in content or sending frequency that recipients did not expect. If your complaint rate rises while open rates decline, recipients may be disengaging before ultimately marking messages as spam.

    Bounce rate and total emails delivered — The total emails delivered count on the Campaign overview equals total emails sent minus all bounces (hard and soft). A high bounce rate directly reduces the pool of delivered emails, which in turn limits the audience available for opens and clicks.

    Tracking Limitations

    Feedback loop coverage — Spam complaints are reported through feedback loops (FBLs) provided by mailbox providers. Not all providers operate FBLs, and some (notably Gmail) do not return individual complaint data to senders. The Spam reports count in Sender reflects only complaints received through available feedback loops and may undercount actual complaints.

    Bounce classification accuracy — Bounce codes returned by mail servers are not always standardized. Some servers return vague or non-standard error codes, which may occasionally lead to a soft bounce being classified differently than expected, or vice versa. Sender categorizes bounces based on the response codes received.

    Delayed bounce reporting — Some bounces, particularly soft bounces, may not be reported immediately by the receiving mail server. This means bounce counts for a campaign may continue to update for a period after sending, and initial statistics may not reflect the final bounce totals.

    Complaint attribution timing — A recipient may report an email as spam days or weeks after receiving it. The complaint is attributed to the original campaign, but the Date / time recorded in the Subscriber actions → Spam reports view reflects when the complaint was processed, not when the email was originally opened or read.

    Common Issues

    Hard bounce rate spikes after importing a new list → The imported list likely contains invalid, outdated, or mistyped email addresses. Clean the list by removing hard-bounced addresses and consider using an email verification service before importing future lists.

    Same addresses soft-bounce repeatedly across campaigns → The recipient's mailbox may be permanently full or abandoned, or the mail server may be consistently rejecting your messages. If an address soft-bounces across three or more consecutive campaigns, consider suppressing it to prevent further delivery attempts.

    Spam complaint rate suddenly increases → This typically follows a change in sending frequency, content style, or audience targeting. Review what changed in recent campaigns — a new segment, higher send volume, or different content format may be driving complaints from recipients who did not expect the message.

    Bounce rate is high but all addresses were confirmed subscribers → Email addresses can become invalid over time due to account closures, domain expirations, or corporate email migrations. Even a confirmed list degrades if not regularly maintained. Implement routine list cleaning to remove addresses that have hard-bounced.

    Spam reports show zero but you suspect complaints exist → Not all mailbox providers return complaint data through feedback loops. Gmail, for example, does not provide individual complaint reports. A zero count in Spam reports does not guarantee zero complaints — it means no complaints were returned through available feedback loops.

    FAQs

    What is the difference between a hard bounce and a soft bounce?

    A hard bounce is a permanent delivery failure — the email address does not exist, the domain is invalid, or the server has permanently rejected the message. A soft bounce is a temporary delivery failure caused by conditions such as a full mailbox, a temporarily unavailable server, or a message that exceeds size limits. Sender tracks both types separately and displays them as hard bounced and soft bounced on the Campaign overview, and as Hard bounce rate and Soft bounce rate on the Dashboard.

    What bounce rate should I be concerned about?

    A combined Bounce rate above 2% per campaign warrants investigation. Hard bounces above 0.5% suggest invalid addresses in your list. Consistent high bounce rates can damage your sender reputation and reduce inbox placement over time. Benchmarks vary by industry and list age.

    What happens to contacts that hard-bounce?

    When an email address generates a hard bounce, Sender records it in the Subscriber actions → Hard bounces list for that campaign. Hard-bounced addresses are typically flagged to prevent further sending, protecting your sender reputation from repeated failed delivery attempts.

    Does a spam complaint automatically unsubscribe the recipient?

    Yes. When a spam complaint is received through a feedback loop, Sender processes the complaint and suppresses future sends to that recipient. The complaint is recorded in the Subscriber actions → Spam reports view for the associated campaign.

    Why is my spam complaint rate showing 0% when I know recipients are unhappy?

    The Average spam rate and Spam reports metrics only reflect complaints returned through mailbox provider feedback loops. Providers like Gmail handle complaints internally and do not report them individually back to senders. A 0% spam rate does not confirm zero complaints — it means no complaint data was received through available channels.

    Can I see which specific subscribers bounced or complained?

    Yes. On the Campaign overview page, expand Subscriber actions in the left sidebar and select Hard bounces, Soft bounces, or Spam reports to view a list of affected email addresses with timestamps. You can also search by email address and export the data.

    How does Sender calculate the Bounce rate on the Dashboard?

    The Bounce rate on the Dashboard is calculated as total bounces (hard and soft combined) divided by total emails sent across all campaigns within the selected date range, expressed as a percentage. The Hard bounce rate and Soft bounce rate break this down by bounce type.

  • Open rate vs click rate

    This guide explains how open rate and click rate are defined, calculated, and interpreted in Sender, and how these two metrics relate to each other when evaluating email performance.

    What these metrics measure

    Open rate measures the percentage of delivered emails that were opened by recipients. It indicates whether your subject line, sender name, and send timing were effective enough to prompt recipients to view your email. Click rate measures the percentage of delivered emails that received at least one link click. It indicates whether your email content, calls to action, and link placement were compelling enough to drive recipient interaction beyond simply opening the message.

    Together, these two metrics represent two distinct stages of email engagement — initial attention (open) and active response (click).

    Metric definitions

    Open rate — Calculated as the number of unique opens divided by the number of delivered emails, expressed as a percentage. This metric appears as opened in the Statistics section of the Campaign overview page, displayed as a percentage with the unique open count in parentheses. It is also shown as opens (percentage) in the Automations list and as Total opens (count) on the Dashboard under Traffic and reach report.

    Click rate — Calculated as the number of unique clicks divided by the number of delivered emails, expressed as a percentage. This metric appears as unique clicks in the Statistics section of the Campaign overview page, displayed as a percentage with the unique click count in parentheses. It is also shown as clicks (percentage) in the Automations list and as Total clicks (count) on the Dashboard under Traffic and reach report.

    Click-to-open rate (CTOR) — Calculated as the number of unique clicks divided by the number of unique opens, expressed as a percentage. While Sender does not display CTOR as a standalone metric card, you can derive it from the opened and unique clicks values shown in the Statistics section of any Campaign overview page. CTOR isolates content engagement among recipients who already opened the email.

    How to interpret the data

    Open rate between 15–25% — Generally considered a healthy range for marketing emails, though benchmarks vary significantly by industry, list size, and audience type. Rates in this range suggest that your subject lines and sender reputation are performing adequately.

    Open rate below 10% — May indicate subject line issues, poor sender reputation, list fatigue, or deliverability problems where emails are landing in spam folders rather than the inbox. Investigate whether your hard bounced or soft bounced rates in the Statistics section are elevated, as delivery failures reduce the denominator and can mask the underlying engagement problem.

    Open rate above 40% — Unusually high open rates may reflect a highly engaged niche audience, or they may be inflated by Apple Mail Privacy Protection pre-loading tracking pixels. Cross-reference with unique clicks to determine whether the high open rate corresponds to genuine engagement.

    Click rate between 2–5% — Generally considered a healthy range for marketing emails. This indicates that a meaningful portion of your delivered audience is interacting with your content and links.

    Click rate below 1% — Suggests that email content, link placement, or calls to action are not resonating with recipients. If your opened rate is healthy but unique clicks are low, the issue is likely with content relevance or email design rather than deliverability or subject lines.

    Click rate above 5% — Indicates strong content engagement. Compare this metric across campaigns in the Email campaigns list using the clicks column to identify which content types or offers generate the highest interaction.

    CTOR between 10–20% — Considered a typical range. A CTOR in this range means that among recipients who opened, a reasonable proportion found the content compelling enough to click. Benchmarks vary by industry and email type.

    CTOR below 5% — Indicates that while recipients are opening the email, the content is not driving clicks. This points to a disconnect between what the subject line promises and what the email delivers, or to weak calls to action.

    How metrics relate to each other

    Open rate as a prerequisite for click rate — A recipient must open an email before they can click a link within it, so click rate is always equal to or lower than open rate. If open rate is low, click rate will be constrained regardless of content quality. Improving open rate by refining subject lines and send timing creates a larger pool of recipients who can then engage with your content.

    Click rate vs CTOR for diagnosing issues — If click rate is low but CTOR is healthy, the problem lies in getting more people to open the email rather than in the email content itself. If both click rate and CTOR are low, the content or calls to action need improvement. Comparing the opened and unique clicks values in the Statistics section helps you isolate whether the bottleneck is at the open stage or the click stage.

    Open rate and deliverability — Open rate is calculated against delivered emails, not sent emails. If your total emails delivered count in the Statistics section is significantly lower than total emails sent, a high bounce rate is reducing your delivered volume. A seemingly healthy open rate may mask the fact that many intended recipients never received the email at all.

    Click rate and unsubscribe rate — Campaigns with consistently low unique clicks and rising unsubscribed values (both visible in the Statistics section) may indicate that your audience is disengaged and beginning to opt out. Monitoring both metrics together helps identify list fatigue before it escalates.

    Opens and clicks over time — The Opens and clicks by day and Opens and clicks by hour charts on the Campaign overview page show how engagement is distributed after sending. A concentrated spike in opens followed by minimal clicks may indicate that the email captured initial attention but failed to sustain interest through the content.

    Tracking limitations

    Pixel-based open tracking — Sender tracks opens by embedding an invisible tracking pixel in each email. The open is registered when the recipient's email client loads this pixel. If a recipient reads the email with images disabled or in a plain-text client, the open is not recorded. This means open rate may undercount actual readership.

    Apple Mail Privacy Protection — Apple Mail Privacy Protection pre-loads tracking pixels through proxy servers for Apple Mail users, regardless of whether the recipient actively views the email. This inflates opened values in the Statistics section. If a significant portion of your audience uses Apple Mail, treat open rate as directional and rely more heavily on unique clicks and CTOR for accurate engagement measurement.

    Link-based click tracking — Sender tracks clicks by wrapping links in your email with tracking redirects. A click is registered when a recipient follows a tracked link. Links that are copied and pasted directly, or that are accessed through email clients that strip tracking parameters, may not be recorded. Click rate may therefore undercount actual link engagement.

    Bot clicks and security scanners — Some corporate email security systems and spam filters automatically follow links in emails to check for malicious content. These automated clicks can inflate unique clicks and Total clicks values, particularly for audiences with high concentrations of corporate or enterprise email addresses.

    Cached and pre-fetched opens — Beyond Apple Mail Privacy Protection, some email clients and proxy services cache or pre-fetch email content including tracking pixels. This can register opens that do not reflect genuine recipient engagement, contributing to inflated open rate figures.

    Common issues

    Open rate appears inflated compared to click rate → Apple Mail Privacy Protection is likely pre-loading tracking pixels for a portion of your audience. Use unique clicks and CTOR as supplementary engagement indicators, and review the Opens and clicks by day chart on the Campaign overview page to check whether the open pattern aligns with realistic human behavior.

    Click rate is zero despite a healthy open rate → Your email may not contain tracked links, or all links may be unsubscribe or preference links that recipients are not engaging with. Verify that your email contains at least one call-to-action link and review the Clicks report tab on the Campaign overview page to confirm that links are being tracked.

    Open rate drops suddenly across campaigns → A sudden decline in opened values in the Email campaigns list may indicate a deliverability issue, such as emails being routed to spam. Check the hard bounced and spam reports metrics in the Statistics section for the affected campaigns, and verify that your sending domain authentication is intact.

    Click rate varies significantly between campaigns → Content relevance, offer strength, and call-to-action design differ across sends. Compare the clicks column in the Email campaigns list to identify patterns in which campaign types generate higher engagement, and use the Clicks report tab to see which specific links received the most interaction.

    CTOR is high but click rate is low → The content is engaging for those who open, but too few recipients are opening the email. Focus on improving subject lines, preview text, and send timing to increase opened rates, which will expand the audience that can interact with your content.

    FAQs

    What is a good open rate?

    Open rates vary by industry, list size, and audience. As a general reference, 15–25% is considered a healthy range for marketing emails. However, Apple Mail Privacy Protection and image-blocking email clients can inflate or deflate reported open rates, so treat this metric as directional rather than exact.

    What is the difference between click rate and click-to-open rate?

    Click rate is calculated as unique clicks divided by total delivered emails — it measures engagement across your entire send. Click-to-open rate (CTOR) is calculated as unique clicks divided by unique opens — it measures how engaging your content was specifically among recipients who opened the email.

    Why is my open rate higher than expected?

    Apple Mail Privacy Protection pre-loads tracking pixels for Apple Mail users, which registers an open even if the recipient did not actively view the email. This can inflate open rate figures. Consider using click rate or CTOR as a supplementary engagement indicator.

    Does Sender track unique opens or total opens?

    Sender tracks both. Unique opens count each recipient once regardless of how many times they open the email. Total opens count every open event including repeat opens by the same recipient. The opened metric in the Statistics section of the Campaign overview page displays the unique open percentage and count by default.

    Why might my click rate be higher than expected?

    Corporate email security systems and spam filters sometimes automatically follow links in emails to scan for threats. These bot clicks inflate unique clicks values. If you notice unusually high click rates from specific domains or immediate clicks within seconds of delivery, automated scanning is a likely cause.

    Can I compare open rate and click rate across campaigns?

    Yes. The Email campaigns list displays opened and clicks columns for each sent campaign, allowing you to compare performance side by side. For automations, the Automations list shows opens and clicks percentages for each workflow.

  • How does ‘Google Analytics’ work?

    In a nutshell, UTM Parameters are tags that you attach to the end of a URL in order to track each click of a link. Once you enable google analytics, the system will automatically add UTM parameters to the links within the campaign.

    There are three types of UTM parameters you can choose from to help you track the traffic. Each one has its own purpose:

    • utm_campaign – indicates the campaign with a certain URL. Sender.net makes the subject line the default identifier.
    • utm_source – identifies the source of your traffic. The default identifier is a username you use on the Sender platform.
    • utm_medium – specifies the medium. In Sender, the default medium is email.

    The UTM parameters can be found in the “Settings” section on the “Account Information” tab. There you can see what the assigned values are. If there is a need to change them, it can be done in the same section by editing the table of the default UTM parameters provided above.

    Here is an example of the youtube.com’s URL and the UTM parameters in it:

    Next time you log into your Google Analytics you will be able to see these statistics.


    If you are stuck on a specific task or can’t find a way to execute a particular job, contact our support team via LiveChat or [email protected] – we’re here to help 24/7.

  • Understand bounce statistics

    First of all, it is crucial to know about hard and soft bounces to be able to fully understand reports. If you don’t know what bounces are, please read the Soft vs Hard bounces article.

    Let’s assume this report is of a campaign you have previously sent.

    There are 76 506 sent emails. The report shows that 0.41% (310) of your emails have hard-bounced and 2.70% (2 069) have soft-bounced. So, the remaining email addresses that have successfully received your campaign are 74 127.

    The open rate percentage is calculated from the successfully reached email addresses, in this case from 74 127 email addresses. This is intentional as the user should focus on the relevant open rates for the valid email addresses.

    That’s it!

    If you got stuck on a specific task or can’t find a way to execute a particular job, contact our support team via LiveChat or [email protected] – we’re here to help 24/7.