Category: Reports overview

  • Transactional email analytics

    This guide explains how to access and use transactional email reports in Sender to monitor delivery health, track engagement, and review individual sending events.

    Where to find this report

    Transactional email analytics are available under the Transactional emails section in the left sidebar. This section contains two reporting pages accessible from the sub-navigation:

    Transactional emails → Metrics opens the Transactional overview page. This is the primary reporting view, displaying summary metric cards and a time-series chart for all transactional sending activity. You can filter by Event type, Domain, and Campaign, and adjust the date range and frequency.

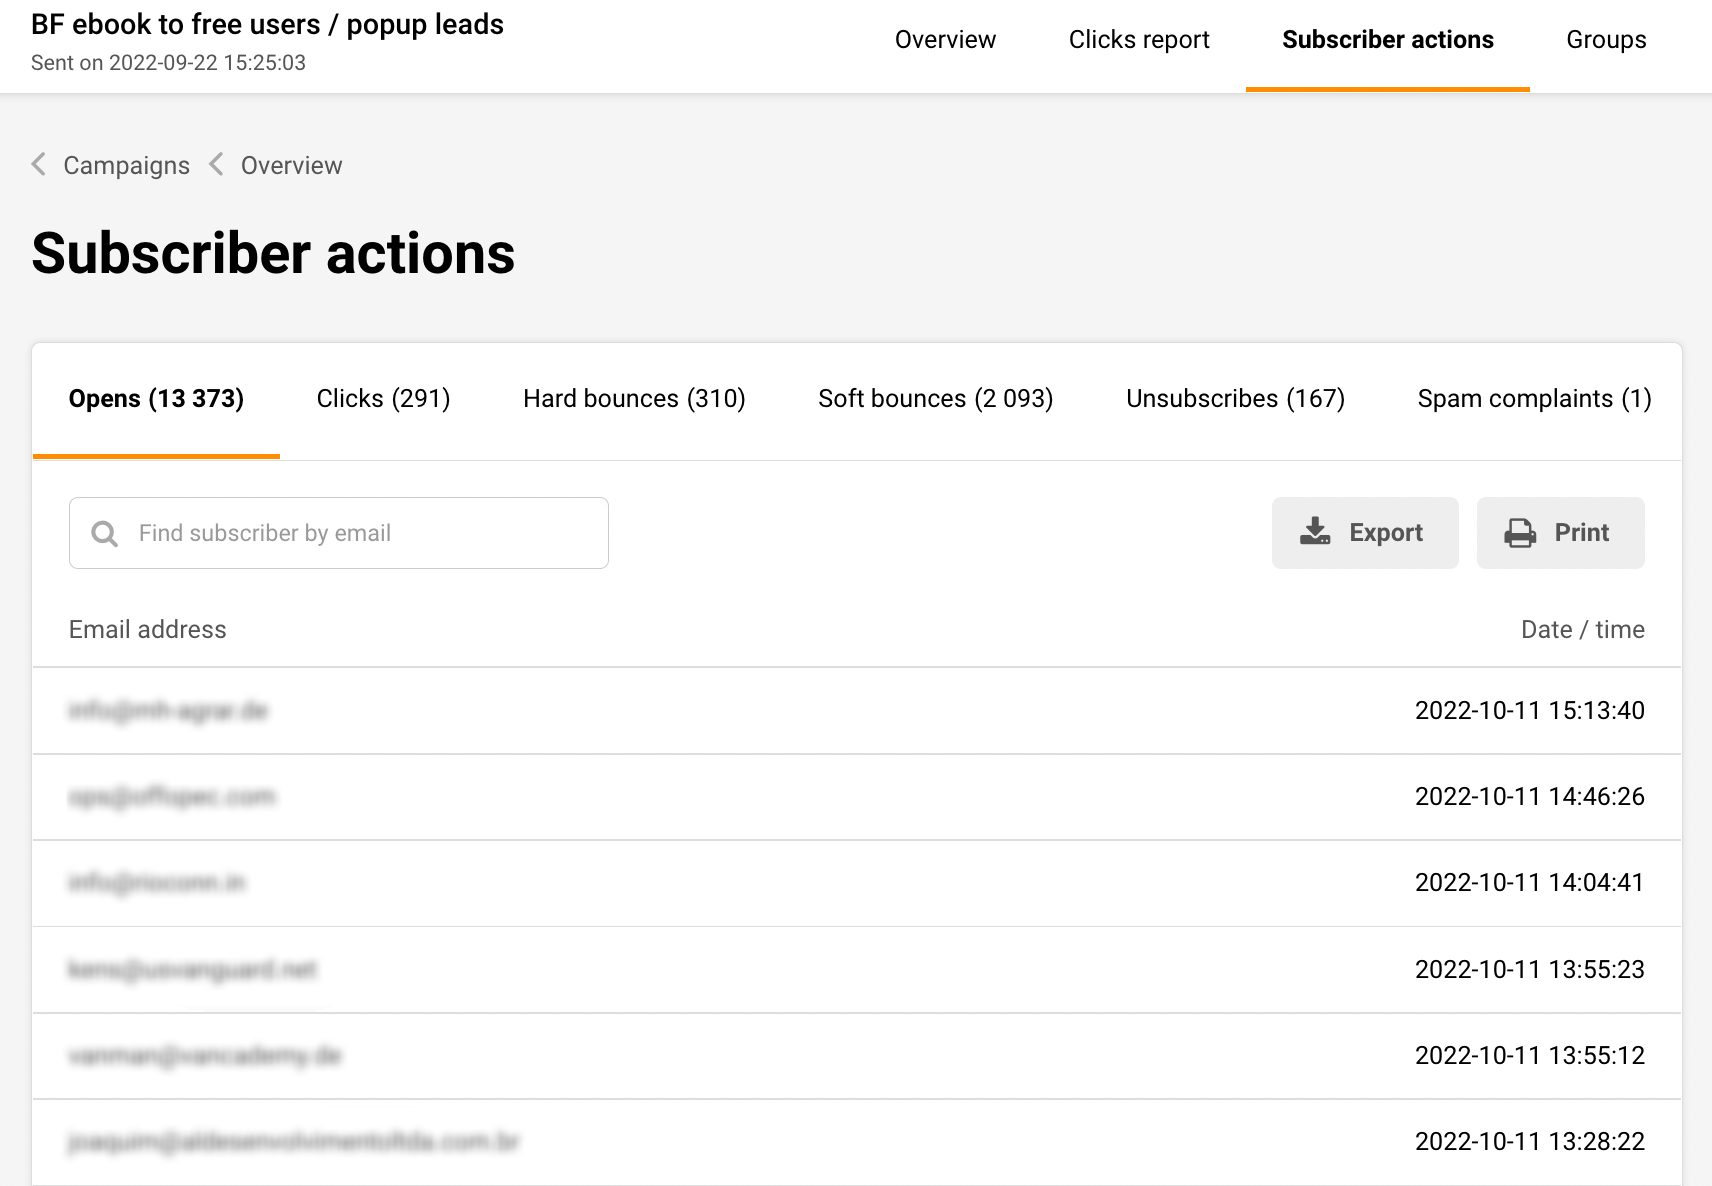
    Transactional emails → Logs opens the Latest events log page. This is the event-level reporting view, displaying a table of individual transactional events with details for each email sent, opened, clicked, bounced, unsubscribed, or marked as spam.

    You can also jump from the Transactional overview page directly to filtered log views by clicking any of the linked metric cards — Total opens, Total clicks, Unsubscribes, Hard bounces, Soft bounces, or Spam reports — which open the Logs page pre-filtered to that event type.

    Steps to access and filter transactional reports

    Step 1 — Open the Transactional overview page

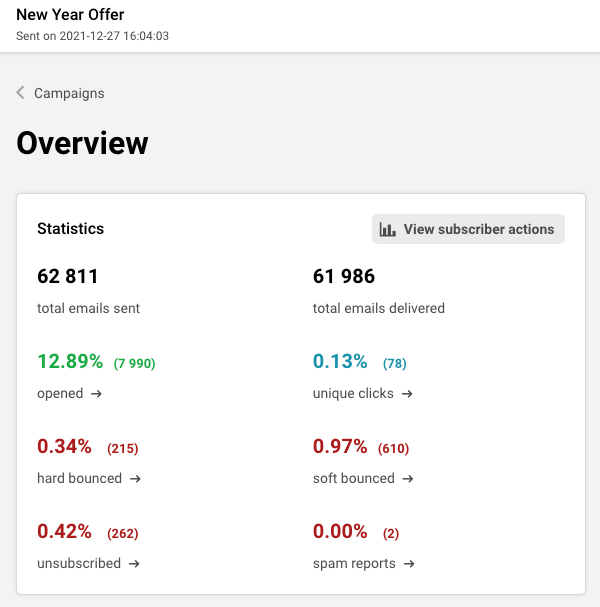
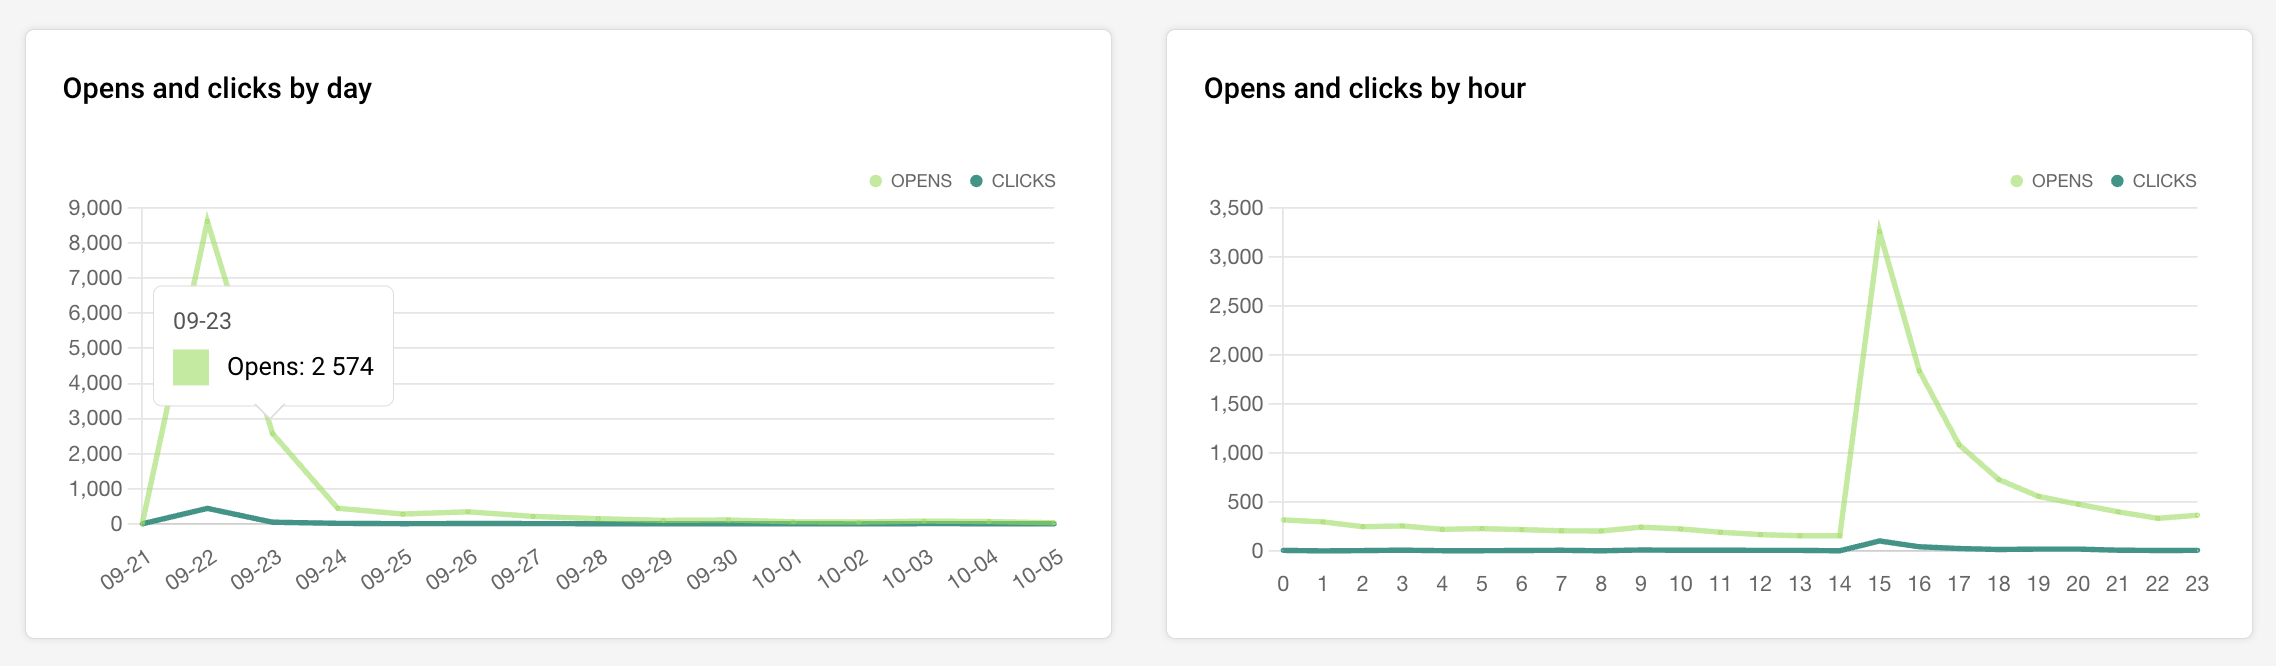
    Click Transactional emails in the left sidebar, then select Metrics from the sub-navigation. The Transactional overview page loads with summary cards across the top row: Total emails sent, Total delivered, Total opens, and Total clicks. A time-series chart plots sending activity below. A second row of cards shows Unsubscribes, Hard bounces, Soft bounces, and Spam reports. By default, data displays for the last 7 days at an Hourly frequency.

    Step 2 — Filter and adjust the date range

    Use the three filter dropdowns at the top left to narrow the data. Event type lets you check or uncheck specific event categories — Emails sent, Opens, Clicks, Bounces, Unsubscribes, and Spam reports — to control what appears on the chart. Domain filters by sending domain, and Campaign filters by a specific transactional template. To change the time period, click the date range selector at the top right and choose a preset such as Last 7 days, Last 30 days, or Last 12 months, or define a Custom range with specific start and end dates. Switch between Hourly, Daily, Weekly, and Monthly frequency toggles to change the chart granularity.

    Step 3 — Review individual events in the Logs page

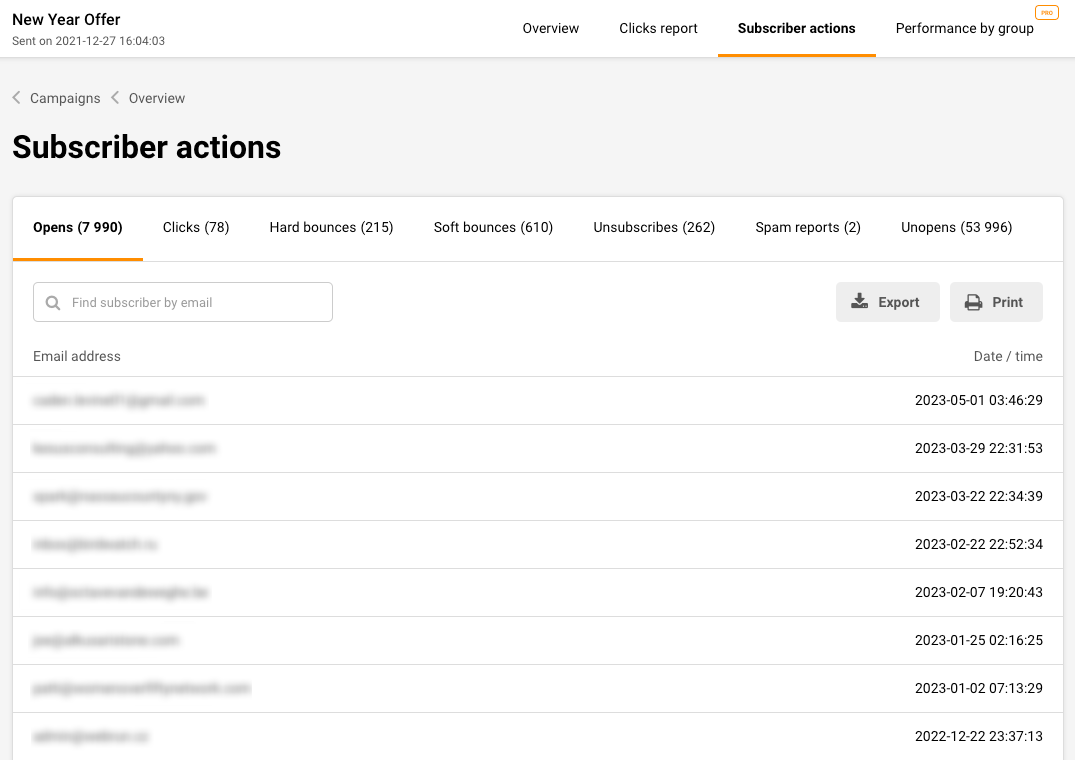
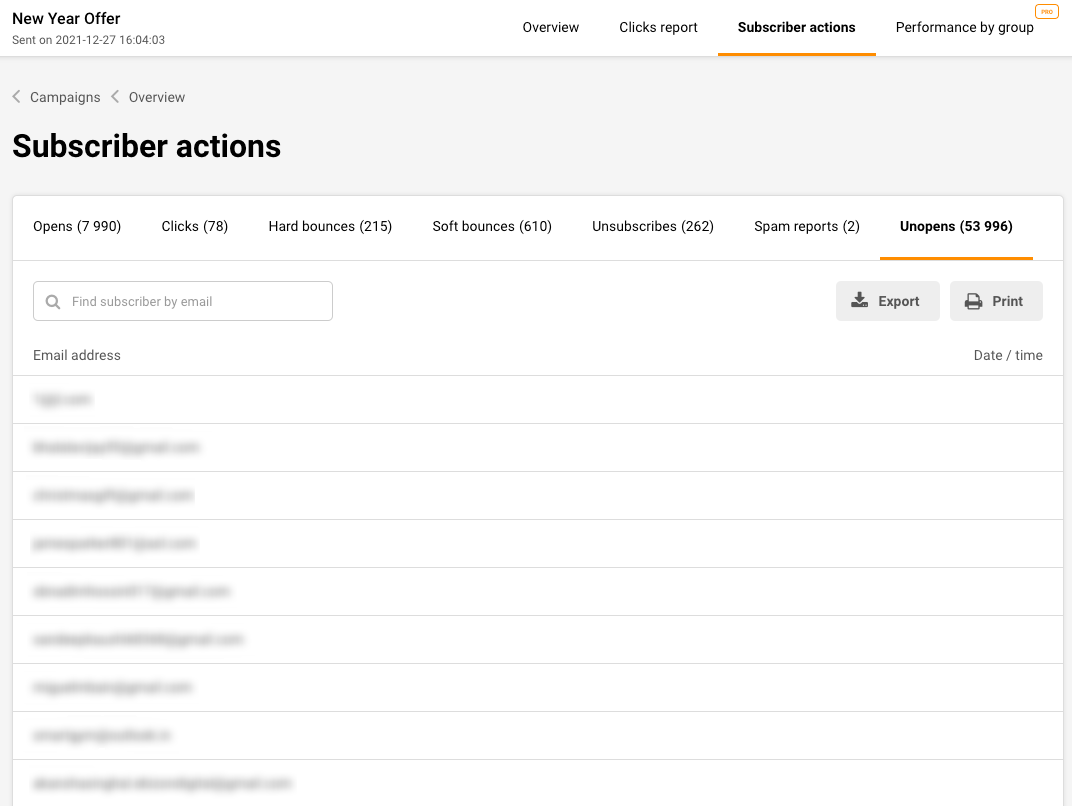
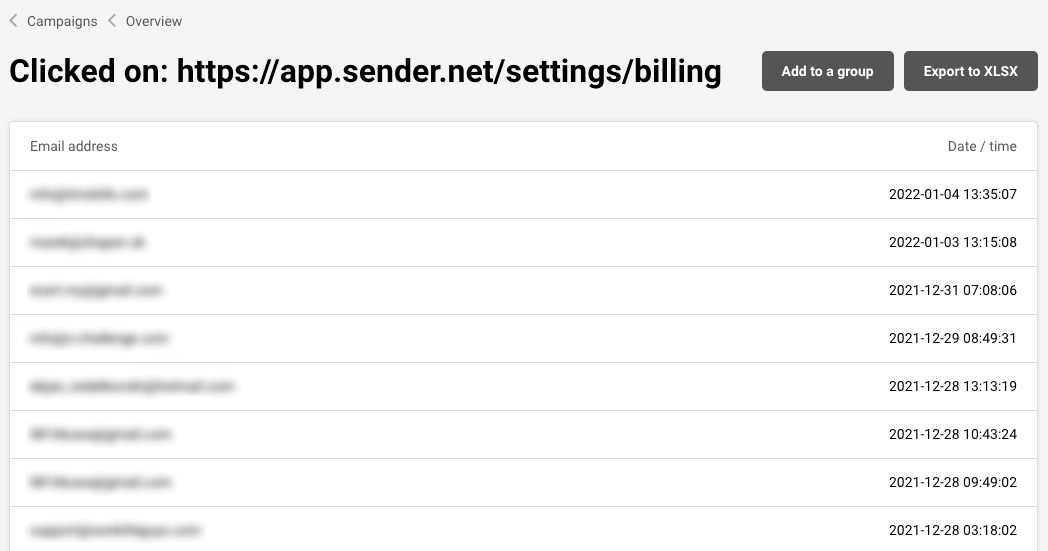
    Click Logs in the sub-navigation to open the Latest events log. This page displays a table with columns for Event, Recipient, Subject, Template, and Date / time. Use the Search field to find events by recipient address or subject line. Apply the Event type, Domain, and Campaign filters to isolate specific event categories — for example, select Bounces from the Event type dropdown to see only bounce events. Adjust the date range to control the reporting window. Use the View dropdown at the bottom to change the number of rows displayed per page (10, 15, 20, 25, or 50).

    Step 4 — Drill down from overview metrics to log details

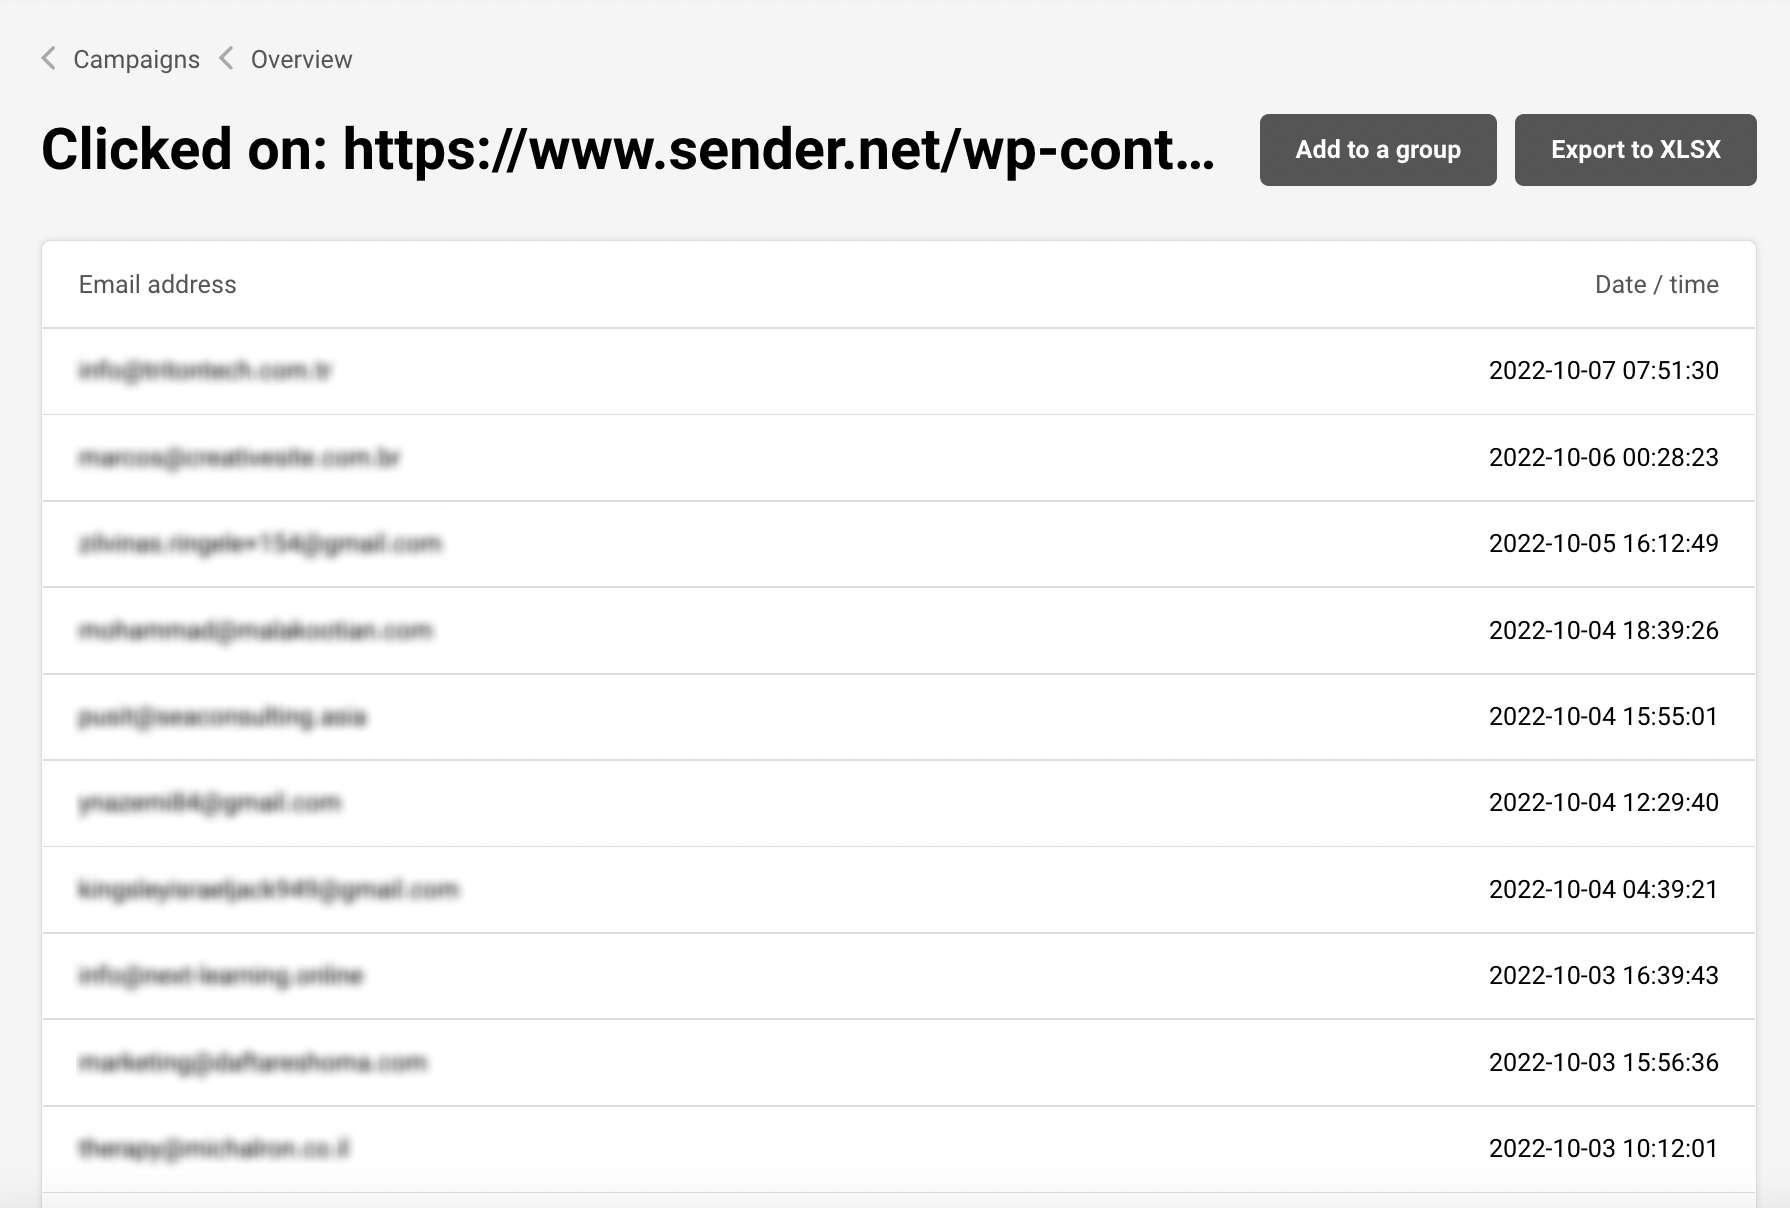
    On the Transactional overview page, click any linked metric card to jump directly to the Logs page with the corresponding event filter pre-applied. Total opens, Total clicks, Unsubscribes, Hard bounces, Soft bounces, and Spam reports all link to filtered log views. This lets you move from an aggregate count to the individual events behind it without manually setting filters on the Logs page.

    Available metrics

    Total emails sent — The total number of transactional emails sent during the selected date range. Displayed as a summary card on the Transactional overview page. This count includes all transactional emails regardless of delivery outcome.

    Total delivered — The number of transactional emails successfully delivered to recipient inboxes during the selected period. Displayed as a summary card on the Transactional overview page.

    Total opens — The number of open events recorded for transactional emails in the selected period. Displayed as a clickable summary card on the Transactional overview page; clicking it opens the Logs page filtered to open events.

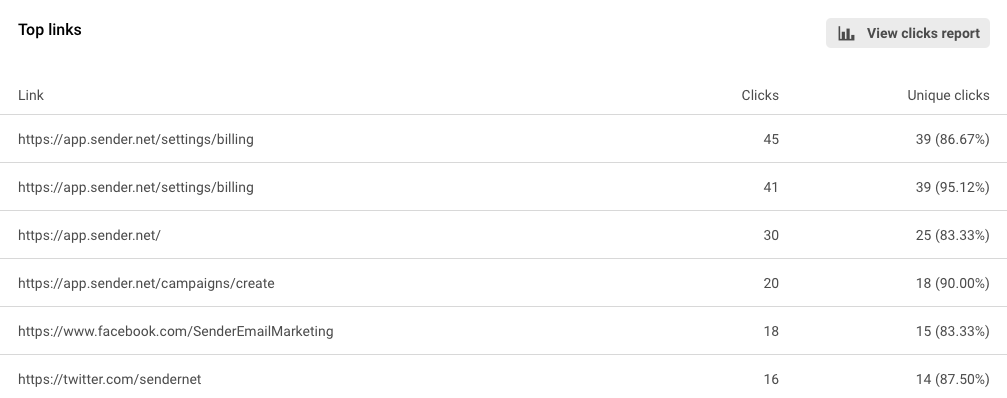
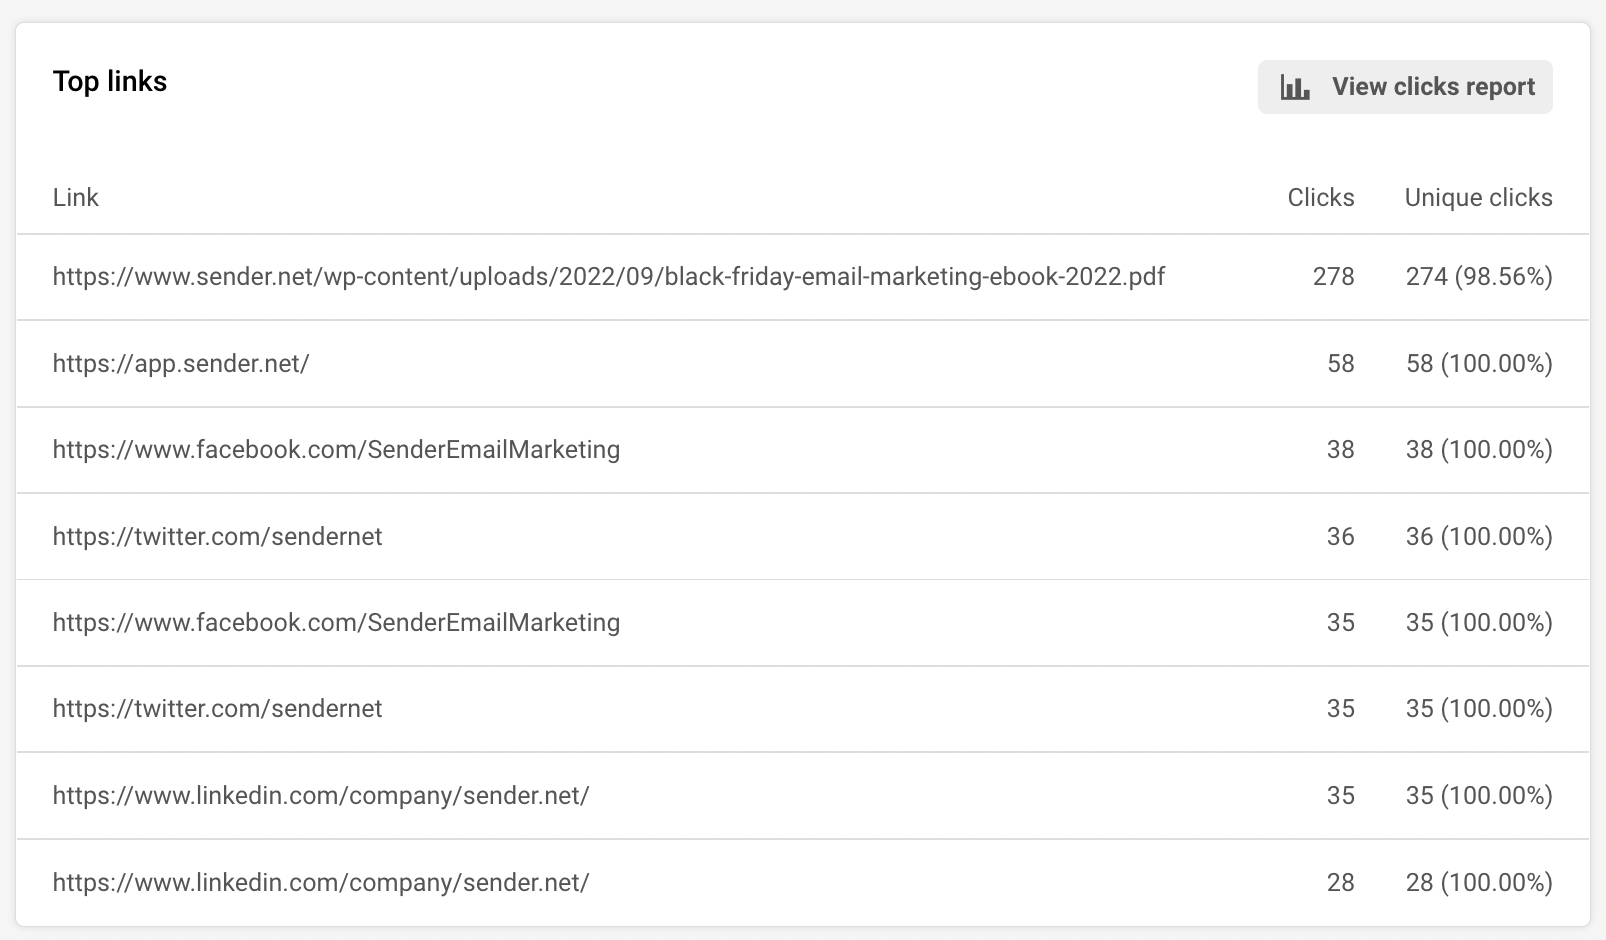
    Total clicks — The number of click events recorded for transactional emails in the selected period. Displayed as a clickable summary card on the Transactional overview page; clicking it opens the Logs page filtered to click events.

    Unsubscribes — The number of recipients who unsubscribed via a transactional email during the selected period. Displayed as a summary card in the second row of the Transactional overview page with a link to the corresponding log entries.

    Hard bounces — The number of transactional emails that permanently failed delivery during the selected period. Displayed as a summary card in the second row of the Transactional overview page with a link to the filtered Logs view.

    Soft bounces — The number of transactional emails that temporarily failed delivery during the selected period. Displayed as a summary card in the second row of the Transactional overview page with a link to the filtered Logs view.

    Spam reports — The number of recipients who reported a transactional email as spam during the selected period. Displayed as a summary card in the second row of the Transactional overview page with a link to the filtered Logs view.

    How to identify performance issues

    Rising hard bounce rate — If the Hard bounces count increases over consecutive periods, it may indicate outdated or invalid recipient addresses in your transactional triggers. Filter the Logs page by Bounces to identify which recipients and templates are affected, and review the source systems feeding those addresses.

    Soft bounce spikes — A sudden increase in Soft bounces can signal temporary delivery issues such as recipient mailbox limits or server throttling. Compare soft bounce counts across Daily or Weekly views to determine whether the pattern is sustained or isolated to a specific time window.

    Spam report increases — Growth in the Spam reports metric suggests recipients do not recognize or want the transactional emails they are receiving. Filter by Campaign to isolate which template is generating complaints, and review the content and sending frequency for that template.

    Low open counts relative to delivered — If Total opens is consistently low compared to Total delivered, transactional emails may be landing in spam folders or recipients may not find the subject lines relevant. Filter by Domain to check whether the issue is isolated to a specific sending domain.

    Declining click engagement — If Total clicks trends downward while Total opens remains stable, the email content or call-to-action may need attention. Switch to Weekly or Monthly frequency to confirm the trend is sustained before making changes.

    Report tips

    Use the Campaign filter to isolate template performance — Select a specific template from the Campaign dropdown on either the Metrics or Logs page to view metrics for that template alone. This helps you compare the performance of different transactional email types such as password resets, order confirmations, or verification emails.

    Switch frequency to match your analysis window — Use Hourly when investigating a specific incident or same-day issue. Use Daily or Weekly for trend analysis over longer periods. Monthly is useful for high-level reporting and identifying seasonal patterns.

    Click metric cards to drill into details — Instead of manually configuring filters on the Logs page, click the linked metric cards on the Transactional overview page to jump directly to a pre-filtered log view for that event type.

    Bookmark filtered views — After applying filters on the Metrics or Logs page, the URL updates to reflect your selections. Bookmark the URL to return to the same filtered view without reconfiguring filters each time.

    Review logs regularly for delivery anomalies — Check the Latest events log page periodically to spot unexpected bounce or spam events before they accumulate into larger delivery problems.

    Common issues

    Metric cards show zero despite active sending → The date range may not cover the period when emails were sent. Click the date range selector and choose a wider range such as Last 30 days or set a Custom range that includes your sending dates.

    Logs page shows "No data found" → Verify that the Event type, Domain, and Campaign filters are not excluding the events you expect. Clear all filters and widen the date range to confirm whether any data exists for the selected period.

    Chart does not update after changing filters → Ensure you have applied the filter selections. Some filter dropdowns require you to click outside the dropdown to confirm. Refresh the page if the chart still does not reflect your selections.

    Clicking a metric card opens an empty log → The linked log view inherits the date range from the overview page. If the date range is too narrow or no events of that type occurred in the period, the log table will be empty. Widen the date range on the Logs page to check for data outside the original window.

    "Select a single day to display data hourly" tooltip appears → The Hourly frequency requires a single-day date range. Select one specific day in the date range picker, or switch to Daily, Weekly, or Monthly frequency for multi-day ranges.

    FAQs

    Can I filter transactional metrics by a specific template? Yes. On the Transactional overview page, click the Campaign dropdown and select the template name. The chart and all summary cards update to show metrics for that template only. The same Campaign filter is available on the Logs page.

    How often are transactional report metrics updated? Metrics update in near real-time. Refresh the page to see the latest data. On the Latest events log page, individual events appear shortly after the email is sent or a recipient event occurs.

    Can I search for a specific recipient in the logs? Yes. Use the Search field at the top of the Latest events log page and enter a recipient email address. The table filters to show only events associated with that address.

    What event types are available in the Event type filter? On the Transactional overview page, the Event type filter includes checkboxes for Emails sent, Opens, Clicks, Bounces, Unsubscribes, and Spam reports. On the Logs page, the same categories appear as selectable options in the Event type dropdown.

    Can I compare transactional metrics across two time periods? Yes. Open the date range picker on the Transactional overview page and enable the Compare toggle. Select two date ranges to view a side-by-side comparison of your transactional metrics.

    What is the difference between the Metrics page and the Logs page? The Metrics page shows aggregated summary cards and a time-series chart for overall transactional sending performance. The Logs page shows individual event-level records in a table, with details for each specific email event including the recipient, subject, template, and timestamp.

  • Campaign analytics explained

    This guide explains how to find, navigate, and understand campaign performance data across the reporting interfaces in Sender's dashboard.

    Where to find this report

    Campaign analytics in Sender are spread across several locations rather than a single reporting page. The primary entry points are:

    In the Sender dashboard, go to Dashboard in the left sidebar to see your account-level performance summary. This page displays the Traffic and reach report with summary metric cards, a time-series chart, and secondary metric cards for bounces, unsubscribes, and spam. Below that, the Subscribers growth section tracks audience changes over time, followed by a Marketing calendar.

    To view individual campaign reports, go to Email campaigns in the left sidebar. The campaign list shows each campaign with its Stats columns — delivered, opened, and clicks. Click the report icon on any sent campaign to open its full Campaign overview report.

    For automation performance, go to Automations in the left sidebar. The automation list displays aggregated stats (emails sent, opens, clicks) for each workflow.

    For transactional email metrics, go to Transactional emails in the left sidebar. The Transactional overview page provides summary cards, a time-series chart, and filter controls for event type, domain, and campaign.

    Steps to navigate campaign analytics

    Step 1 — Open the Dashboard overview

    Click Dashboard in the left sidebar. At the top of the page, the Traffic and reach report panel displays summary cards for Total emails sent, Total delivered, Total opens, and Total clicks. Below the cards, a time-series chart plots these three metrics over the selected date range. A second row of cards shows Total unsubscribers, Total bounces, Bounce rate, Total spams, Unsubscribe rate, Hard bounce rate, Soft bounce rate, and Average spam rate.

    Step 2 — Adjust the date range and dashboard panels

    Click the date range picker in the top-right corner of the Dashboard page. Select a preset range such as Last 7 days, Last 30 days, Last 3 months, or Last year, or enter a custom date range using the Custom range fields. Toggle the Compare switch to compare the current period against a previous one. Click Apply to update all dashboard panels. Use the Overview settings dropdown next to the date picker to show, hide, or reorder panels like Traffic and reach report, Subscribers growth, and Marketing calendar.

    Step 3 — Open an individual campaign report

    Click Email campaigns in the left sidebar. Use the search bar to find a campaign by name, or click Filter to narrow the list by status — All, Draft, Scheduled, Sending, or Sent. Locate a sent campaign and click its report icon in the Actions column to open the Campaign overview page. The Statistics section at the top displays cards for total emails sent, total emails delivered, opened, unique clicks, hard bounced, soft bounced, unsubscribed, and spam reports.

    Step 4 — Explore campaign report tabs

    On the Campaign overview page, use the left-side navigation panel to switch between report views. Overview shows the email settings, statistics cards, an Ecommerce section (with Total revenue, Number of orders, Revenue per customer, and ROI), and Opens and clicks by day and Opens and clicks by hour charts. Clicks report displays a visual click map of your email. Subscriber actions expands to show filterable lists broken down by Opens, Clicks, Hard bounces, Soft bounces, Unsubscribes, Spam reports, Unopens, and Purchases, each with a count.

    Step 5 — Review automation workflow stats

    Click Automations in the left sidebar. The automation list shows each workflow with Stats columns for emails sent, opens, and clicks. Click the edit icon on any workflow to open the automation builder, where each Send an email step in the workflow can be clicked to view its individual performance data in the right-side panel. Active workflows display step-level metrics including sends, opens, clicks, bounces, and unsubscribes.

    Step 6 — Navigate transactional email metrics

    Click Transactional emails in the left sidebar. The Transactional overview page opens, showing summary cards for Total emails sent, Total delivered, Total opens, and Total clicks, a time-series chart, and secondary cards for Unsubscribes, Hard bounces, Soft bounces, and Spam reports. Use the Event type dropdown to filter the chart by specific events such as Emails sent, Opens, Clicks, Bounces, Unsubscribes, or Spam reports. Filter further by Domain or Campaign, and switch granularity between Hourly, Daily, Weekly, and Monthly.

    Step 7 — View the transactional events log

    In the Transactional emails section, click Logs in the left sidebar to open the Latest events log. This page displays a table with columns for Event, Recipient, Subject, Template, and Date / time. Use the search bar to find events by recipient or subject, and filter by Event type, Domain, or Campaign. Adjust the date range picker to narrow results to a specific time period.

    Step 8 — Export dashboard data

    On the Dashboard page, click the Export button in the top-right area, next to the date range picker. This exports the dashboard metrics for the currently selected date range. On individual campaign reports, use the Print report button in the top-right corner of the Campaign overview page to generate a printable version of the report.

    Metrics explained

    Total emails sent — The total number of emails dispatched from your account during the selected period. This counts every send attempt, regardless of whether the email was delivered, bounced, or deferred.

    Total delivered — The number of emails that were successfully accepted by the recipient's mail server. This does not guarantee the email reached the inbox — it may have been routed to spam.

    Total opens — The number of times recipients opened your email, tracked via an embedded tracking pixel. A single recipient opening the same email multiple times may increment this count.

    Total clicks — The total number of times links in your email were clicked. This includes all clicks, so one recipient clicking the same link twice counts as two clicks.

    Unique clicks — The number of individual recipients who clicked at least one link in the email. Each recipient is counted only once regardless of how many links they clicked or how many times.

    Opened (rate) — The percentage of delivered emails that were opened at least once. Calculated as opens divided by total delivered, displayed as a percentage.

    Hard bounced (rate) — The percentage of sent emails that permanently failed delivery, typically because the recipient address does not exist or the domain is invalid. Persistent high hard bounce rates can harm sender reputation.

    Soft bounced (rate) — The percentage of sent emails that temporarily failed delivery due to issues like a full mailbox or a temporarily unavailable server. Soft bounces may succeed on a retry.

    Unsubscribed (rate) — The percentage of delivered emails where the recipient clicked the unsubscribe link. Calculated as unsubscribes divided by total delivered.

    Spam reports — The number of recipients who marked your email as spam. Even small numbers here are worth monitoring, as spam complaints directly affect sender reputation.

    Bounce rate — The combined percentage of hard and soft bounces relative to total emails sent. Displayed on the Dashboard overview as an aggregate metric across all campaigns in the date range.

    Average spam rate — The average percentage of spam complaints across all campaigns in the selected period. Displayed on the Dashboard page.

    Report tips

    Use status filters on the campaign list — Click Filter on the Email campaigns page and select Sent to show only campaigns with performance data, hiding drafts and scheduled sends from the list.

    Compare periods on the Dashboard — Toggle the Compare switch in the date range picker to see how current metrics perform against a previous period. This helps identify trends without manually noting earlier numbers.

    Check the clicks report for link engagement — On any sent campaign's report, switch to the Clicks report tab to see a visual click map of your email, showing which links received the most attention.

    Use the Subscriber actions breakdown — Expand the Subscriber actions section in a campaign report to see exactly which recipients opened, clicked, bounced, unsubscribed, or reported spam. This is useful for list hygiene and segmentation.

    Adjust transactional chart granularity — On the Transactional overview page, switch between Hourly, Daily, Weekly, and Monthly views to match the level of detail you need for your analysis.

    Common issues

    Campaign shows dashes instead of stats → The campaign is still in Draft, Scheduled, or Sending status. Stats only populate after emails have been sent and recipient interactions are recorded. Wait until the campaign status changes to Sent.

    Open rate appears unusually low → Open tracking relies on a tracking pixel embedded in the email. If a recipient's email client blocks images by default, the open is not recorded. Actual opens may be higher than reported.

    Dashboard metrics do not match the campaign report → The Dashboard shows aggregated metrics across all campaigns within the selected date range, while a campaign report shows data for that single campaign only. Verify that the Dashboard date range includes the campaign's send date.

    Transactional overview shows no data → Check that the date range is set to a period when transactional emails were sent. Also verify that the Event type, Domain, and Campaign filters are not excluding the data you expect to see.

    Ecommerce section is blank on the campaign report → The Ecommerce data requires a connected store integration. If no ecommerce integration is installed, the Total revenue, Number of orders, Revenue per customer, and ROI fields remain empty.

    FAQs

    How often are report metrics updated? Most metrics update in near real-time. Refresh the page to see the latest data. Some aggregated metrics on the Dashboard overview may have a short delay.

    Can I export my report data? Yes. On the Dashboard, click the Export button in the top-right area to download metrics for the selected date range. On individual campaign reports, use the Print report button to generate a printable version of the campaign's performance data.

    Why does my open rate seem low? Open tracking relies on a tracking pixel embedded in the email. If a recipient's email client blocks images by default, the open is not recorded. This means actual opens may be higher than reported.

    What is the difference between the Dashboard and individual campaign reports? The Dashboard provides an account-level summary of recent performance across all sending channels for the selected date range. Individual campaign reports, accessed through the Email campaigns list, show detailed metrics, click maps, subscriber action breakdowns, and engagement charts for a single campaign.

    Can I see reports for a single automation email? Yes. Go to Automations, open the workflow, and click on any Send an email step. The right-side panel displays that step's individual performance metrics, including sends, opens, clicks, bounces, and unsubscribes.

    How do I filter transactional email reports by event type? On the Transactional overview page, click the Event type dropdown at the top of the page. Check or uncheck the event types you want to include — Emails sent, Opens, Clicks, Bounces, Unsubscribes, and Spam reports — to update the chart and summary cards accordingly.

    Can I see which subscribers performed specific actions on a campaign? Yes. Open a sent campaign's Campaign overview report and expand the Subscriber actions section in the left navigation. Select a specific action such as Opens, Clicks, or Unsubscribes to view the list of subscribers who performed that action.

  • Automation performance reports

    This guide explains how to access and read performance reports for your automation workflows and transactional emails in Sender. Use these reports to evaluate workflow effectiveness, identify underperforming steps, and monitor transactional delivery health.

    Where to find this report

    Automation reports are accessible from two locations. On the Automations list page, each workflow row displays summary Stats — emails sent, opens, and clicks — giving you a quick performance snapshot without opening the workflow. To see detailed data, click the edit icon to open the workflow builder, where the right-side panel displays either the Workflow report or an individual Email report depending on what you select on the canvas.

    Transactional email reports live under Transactional emails → Metrics, which opens the Transactional overview page. The Logs page in the same sidebar provides individual event-level data.

    Steps to access automation and transactional reports

    Step 1 — Review workflow-level performance on the Automations list

    Go to Automations from the main sidebar. Each workflow row shows aggregated Stats: total emails sent, opens percentage, and clicks percentage. Use the Filter dropdown to switch between All, Active, and Draft workflows. Use the Sort button or the Find workflow by name search bar to locate a specific automation. This view lets you compare performance across all workflows at a glance.

    Step 2 — Open the Workflow report in the builder

    Click the edit icon on any active workflow to open the workflow builder. Click an empty area of the canvas background to display the Workflow report panel on the right side. This panel shows aggregated metrics for the entire automation, including Completed automation, Subscribers in automation, and Total emails sent. Use these figures to understand overall throughput and how many contacts have finished the sequence.

    Step 3 — View step-level Email reports

    Click any email step on the canvas to open its Email report panel on the right side. This panel displays per-step performance: Emails sent, Open rate, Click rate, Unsubscribe rate, and Bounce rate. The Subscribers currently at this step counter shows how many contacts are waiting at that point in the workflow. Click Full report for a detailed breakdown of that step's data.

    Step 4 — Access the Transactional overview page

    Navigate to Transactional emails → Metrics to open the Transactional overview page. The top row of summary cards displays Total emails sent, Total delivered, Total opens, and Total clicks. Below the chart, a second row shows Unsubscribes, Hard bounces, Soft bounces, and Spam reports. Use the Event type, Domain, and Campaign filters to narrow the data. Switch between Hourly, Daily, Weekly, and Monthly frequency views, and set a custom date range using the date picker.

    Step 5 — Review individual events on the Logs page

    Click Logs in the transactional sidebar to open the Latest events log page. Each row shows the Event type, Recipient, Subject, Template, and Date / time. Use the Event type filter to isolate specific events such as Bounces or Spam reports. Apply the Domain and Campaign filters or the Search bar to find specific recipients or subjects. Adjust the date range to control the time window displayed.

    Available metrics

    Emails sent (automation list) — The total number of emails sent across all steps in the workflow. Displayed in the Stats column on the Automations list page.

    Opens (automation list) — The open rate percentage for the entire workflow. Displayed in the Stats column on the Automations list page next to emails sent.

    Clicks (automation list) — The click rate percentage for the entire workflow. Displayed in the Stats column on the Automations list page.

    Completed automation — The number of subscribers who have finished all steps in the workflow. Displayed in the Workflow report panel when you click the canvas background.

    Subscribers in automation — The number of contacts currently active inside the workflow. Displayed in the Workflow report panel.

    Total emails sent (workflow) — The cumulative count of all emails sent by the automation across every step. Displayed in the Workflow report panel.

    Emails sent (step-level) — The number of emails sent by a specific email step. Displayed in the Email report panel when you click an email step.

    Open rate (step-level) — The percentage of recipients who opened the email at that step. Displayed in the Email report panel.

    Click rate (step-level) — The percentage of recipients who clicked a link in the email at that step. Displayed in the Email report panel.

    Unsubscribe rate (step-level) — The percentage of recipients who unsubscribed after receiving the email at that step. Displayed in the Email report panel.

    Bounce rate (step-level) — The percentage of emails that bounced at that step. Displayed in the Email report panel.

    Subscribers currently at this step — The number of contacts waiting at a specific step in the workflow. Displayed in the Email report panel for each email step.

    Total emails sent (transactional) — The total number of transactional emails sent in the selected period. Displayed as a summary card on the Transactional overview page.

    Total delivered (transactional) — The number of transactional emails successfully delivered. Displayed as a summary card on the Transactional overview page.

    Total opens (transactional) — The number of transactional emails opened. Displayed as a summary card on the Transactional overview page.

    Total clicks (transactional) — The number of link clicks in transactional emails. Displayed as a summary card on the Transactional overview page.

    Hard bounces — The count of transactional emails that permanently failed delivery. Displayed in the secondary metric row on the Transactional overview page.

    Soft bounces — The count of transactional emails that temporarily failed delivery. Displayed in the secondary metric row on the Transactional overview page.

    Unsubscribes (transactional) — The number of recipients who unsubscribed from transactional emails. Displayed in the secondary metric row on the Transactional overview page.

    Spam reports — The number of recipients who marked transactional emails as spam. Displayed in the secondary metric row on the Transactional overview page.

    How to identify performance issues

    Step-level drop-off — Compare the Subscribers currently at this step count across consecutive email steps. A large gap between one step and the next indicates contacts are leaving the workflow at that point, potentially due to a long delay, an unsubscribe, or a condition filtering them out.

    Declining open rates across steps — If later email steps show progressively lower Open rate values compared to earlier steps, your subject lines may be losing relevance or recipients may be disengaging over time. Review subject lines and timing for steps with the steepest drops.

    High bounce rate on a specific step — A step with a noticeably higher Bounce rate than other steps may indicate a list quality issue with the segment entering the automation, or a deliverability problem with that particular email. Check subscriber sources feeding into the trigger.

    Rising transactional hard bounces — On the Transactional overview page, a sustained increase in Hard bounces over time signals that your recipient lists may contain invalid addresses. Switch to Daily or Weekly frequency to spot upward trends and investigate the source of new addresses.

    Spam report spikes — A sudden increase in Spam reports on the Transactional overview page suggests recipients are not expecting the emails. Use the Campaign filter to isolate which template is generating reports, and review its content and sending frequency.

    Low click rate with normal open rate — If a step shows a healthy Open rate but a low Click rate, the email content or call-to-action may not be compelling enough. This pattern points to a content optimization opportunity rather than a deliverability problem.

    Report tips

    Filter the automation list by status — Use the Filter dropdown on the Automations page to show only Active workflows. This removes draft clutter and lets you focus on workflows that are generating live data.

    Use the Compare toggle for transactional trends — In the date range picker on the Transactional overview page, enable the Compare toggle to compare the current period against a previous one. This makes it easier to spot changes in delivery or engagement patterns.

    Check step-level metrics sequentially — Click each email step in order from top to bottom in the workflow builder to review how performance changes across the sequence. This step-by-step review is the most reliable way to find the exact point where engagement drops.

    Switch frequency views for different insights — On the Transactional overview page, use Hourly to investigate a specific day's sending pattern, Daily or Weekly for short-term trends, and Monthly for long-term performance tracking.

    Use the Campaign filter to isolate templates — On both the Transactional overview and Latest events log pages, select a specific template from the Campaign dropdown to see metrics for that template only. This is essential when you have multiple transactional email types and need to evaluate each one separately.

    Common issues

    Automation stats show 0 emails sent → The workflow is in Draft status and has not been activated. Click Activate on the workflow to begin sending. Stats populate only after the automation starts processing subscribers.

    Workflow report panel not visible → You may have an email step or trigger selected. Click an empty area of the canvas background to deselect all steps and display the Workflow report panel on the right side.

    Transactional metrics show no data → No transactional emails have been sent in the selected date range. Adjust the date range using the date picker, or confirm that your transactional sending is configured under Setup instructions in the transactional sidebar.

    Event type filter not narrowing results → On the Transactional overview page, the Event type filter uses checkboxes. Make sure you have unchecked the event types you want to exclude. All event types are selected by default.

    Logs page shows "No data found" → The selected date range or filters may be too narrow. Expand the date range or remove filters from Event type, Domain, and Campaign to see all logged events.

    FAQs

    Can I see performance for a single email step in an automation?

    Yes. Open the automation in the workflow builder and click any email step. The Email report panel displays Emails sent, Open rate, Click rate, Unsubscribe rate, and Bounce rate for that specific step. Click Full report for detailed data.

    How do I find drop-off points in my automation?

    Compare the Subscribers currently at this step count across consecutive steps. A large gap between one step and the next suggests contacts are dropping off — possibly due to a long delay, an unsubscribe, or a condition filtering them out.

    Can I filter transactional metrics by a specific template?

    Yes. On the Transactional overview page, use the Campaign dropdown and select the template name. The chart and summary cards update to show metrics for that template only.

    How often are automation and transactional report metrics updated?

    Metrics update in near real-time. Refresh the page to see the latest data. For transactional logs, individual events appear shortly after the email is sent or an event occurs.

    What is the difference between the automation Workflow report and individual step reports?

    The Workflow report shows aggregated metrics for the entire automation — Completed automation, Subscribers in automation, and Total emails sent. Individual step reports show per-email performance (sends, opens, clicks, bounces, unsubscribes) for each specific email in the sequence.

    Can I compare transactional performance across two time periods?

    Yes. Click the date range selector on the Transactional overview page and enable the Compare toggle. Set the two date ranges you want to compare and click Apply. The chart and summary cards display both periods for side-by-side analysis.

    How do I filter transactional logs to show only bounces?

    On the Latest events log page, click the Event type dropdown and select Bounces. The table updates to show only bounce events, with the Recipient, Subject, Template, and Date / time for each.

  • View reports in Sender

    Ecommerce sales reports

    This feature gets enabled when:

    • You have a paid Sender account;
    • The same is integrated with your online Shopify store.

    Form reports

    Click “Forms” on the main dashboard to access the list of forms.

    Clicking on “Overview” next to a specific form, will take you to detailed statistics for that instance of the form.

    Please note that a graph is shown only if there has been new visitors and/or sign-ups in the past two weeks.

    Automation reports

    Click “Automation” on the main dashboard to access the list of workflows. Hit “View report” next to an automation to access data and analytics for the same.

    To see the overall workflow performance, click the trigger step at the very top of the automation map.

    To view the performance report of a particular step, click on the step in the map.

    Next, hit the “Full Report” button on the dashboard to the right to generate detailed stats on what happened here.

    Email campaign reports

    Immediately after the campaign has been sent, the system begins tracking, analyzing data, such as clicks, opens, bounces, and unique clicks. 

    The reports are updated every few minutes so rest assured you get the very best of LIVE data to view and work with, at all times.

    Click “Email campaign” -> On the campaign section, click “View report” to access the newsletters report. 

    The “Overview” section provides a convenient summary of your campaign’s key statistics. It covers:

    • Total emails sent — This is the total number of emails that were attempted to be sent;
    • Total emails delivered — This is the total number of emails actually delivered to the recipient email servers. Usually, unless there is a technical issue, this number should be the same as the total emails sent;
    • Opened — The number of emails opened by recipients. This is calculated by taking into account the total emails delivered (not accounting for hard or soft bounces);
    • Unique clicks — This shows you the number of unique clicks received on your campaign. If someone has clicked on a single link multiple times, Sender will count it as a single click only;
    • Hard-bounced — These are the incorrect or non-existent email addresses that could not be delivered to and hence should be cleaned from your list;
    • Soft-bounced — These are email addresses that could not be delivered to temporarily for technical reasons. Delivery will be attempted at least thrice before marking unreachable inboxes as hard bounces;
    • Unsubscribed — Subscribers who have chosen to opt out of your email campaigns for some reason;
    • Spam complaints (recipient’s reported spam) — These are contacts who have found your email marketing approach (for example, frequency) or content (for example, too aggressive or salesy) spammy and have reported you to their inbox provider such as Google, Yahoo etc.

    Each of the above summary counters is clickable. Click to view comprehensive statistics about that category.

    Clicking “View Subscriber Actions” will take you to a screen that will show you the break up by subscriber action taken. For example, by Opens, Clicks etc. Now you can tell which email addresses opened your email, which ones hard bounced and who opted out or marked you spam.

    One interesting use case is that clicking on the “Unopened” tab will let you see the subscribers who have not opened your campaign.

    Top links report: Sender tracks the performance of your links used in a particular campaign and presents this to you as shown below. It can be found by scrolling down in the overview section.

    Clicks represent the total number of clicks received for that link while unique clicks are the number of unique subscribers who clicked.

    Clicking on any of the links above will take you to the list of recipients who actually clicked on the link. You can export the list or add them all to a particular group.

    Operating system, Platform and Browser report:

    This report shows you the breakdown of your email campaign performance by the technology at the subscriber end e.g. the device, browser and operating systems being used to open the email.

    Visual graphs: Scroll some more down and you will see a graphical representation of the opens and clicks for this campaign by hour and by day.

    Breakdown by geo-location: The report towards the bottom of the page shows the breakdown of your subscribers list by their email providers’ servers location.

    SMS campaign reports

    Click “SMS Campaigns” and then hit the “View report” next to the SMS campaign whose performance you would like to view.

    Below in the overview section, you will find the following data counters:

    • Sent — Total number of text messages sent;(the amount of sent SMS campaigns);
    • Delivered — The number of text messages successfully delivered in this campaign;
    • Click rate — Percentage of recipients who clicked the link in your SMS;
    • Unsubscribed — Those who chose to opt out of your SMS campaigns;
    • Failed deliveries — These are the number of SMS recipients who could not be reached, either because of incorrect mobile numbers, the subscribers being out of range, or some other technical issues.

    If you got stuck on a specific task or can’t find a way to execute a particular job, contact our support team via LiveChat or [email protected] – we’re here to help 24/7.

  • Campaign reports overview

    How do I use reports?

    After the campaign is sent, the system will begin to track, analyze data – clicks, opens, bounces, unique clicks, etc. The newsletters report is located behind the “View report” button on the campaign section. Reports are updated every few minutes.

    Here’s how the general overview looks:

    Overview

    Let’s start with the first section. Just below the overview of your results, you will find six different counters:

    • Total emails sent.
    • Total emails delivered.
    • Opened.
    • Unique clicks.
    • Hard-bounced.
    • Soft-bounced.
    • Unsubscribed.
    • Spam complaints (recipient’s reported spam).

    Each report counter is clickable. Simply click to view every individual report.

    Next, let’s continue with the campaign’s links. As you may already know, system tracks the performance of all campaign’s links and stored the data.

    We got two columns :

    • Clicks (shows all clicks, including duplicates)
    • Unique clicks

    When a user clicked on the link, the recipient’s that click the link will appear. Next, if you click on an individual recipient, you will access its records, basically prior actions. Furthermore, you can assign subscribers to a particular group by clicking “Add group” button.

    Okay, we are halfway through the report section.

    Let’s continue with the browser, operating system, and platform statistics. These charts are pretty self-explanatory. You see the statistics where recipients open newsletters.

    The next graph is a visual chart of your campaign’s opens and clicks. The first graph shows performance per day, other – per hour.

    The last report shows the geographic statistic. You can view the newsletter’s performance according to the recipients’ email providers’ servers location. 

    That’s it!

    If you got stuck on a specific task or can’t find a way to execute a particular job, contact our support team via LiveChat or [email protected] – we’re here to help 24/7.