Category: Engagement and subscriber activity

  • Subscriber Growth and List Analytics

    This guide explains how to track subscriber growth trends, review list-level analytics, and use form conversion data to understand how your audience is growing in Sender.

    Where to Find This Data

    Subscriber growth and list analytics data is available across several locations in Sender.

    The Dashboard includes the Subscribers growth panel, which displays Total new subscribers, Total unsubscribers, and Total bounces over a selected date range, with a bar chart showing daily changes. Use the Show data for dropdown to filter growth data by a specific group or view all groups and segments.

    The Subscribers list page provides a filterable table of all contacts with columns for Status, Groups, Date added, and more. The Advanced filter lets you narrow results by campaign activity such as Opened, Clicked, or Was inactive.

    Individual subscriber profiles are accessible by clicking any subscriber in the list. Each profile includes a Subscriber activity timeline showing a chronological log of interactions.

    The Groups page under Subscribers shows per-group breakdowns of Active, Total, Unsubscribed, and Bounced counts.

    The Segments page lists pre-built and custom segments with Active subscribers and Total subscribers counts, including engagement-based segments like Highly engaged subscribers and Unengaged subscribers 180 days.

    The Forms page displays performance stats for each form, including subscribed, visitors, and conversion rate.

    Steps to Access Subscriber Growth and List Analytics

    Step 1 — Review Subscriber Growth on the Dashboard

    Go to the Dashboard and scroll down to the Subscribers growth panel. This panel displays Total new subscribers, Total unsubscribers, and Total bounces for the selected date range.

    Use the date range selector in the top-right corner to choose a preset like Last 7 days, Last 30 days, or Last 12 months, or set a Custom range. Use the Show data for dropdown to filter the growth chart by a specific group or keep it set to All groups and segments. The bar chart below visualizes daily subscriber additions over the selected period.

    Step 2 — Filter and Review Subscribers by Engagement Activity

    Go to Subscribers → Subscribers to open the subscriber list. Click Advanced filter to open the filter panel. Select a condition from the first dropdown — under Campaign activity, choose Opened, Clicked, or Was inactive to filter subscribers by their engagement behavior.

    Set the condition operator and select the relevant campaign or time frame. Click Add condition to layer additional filters. The subscriber list updates to show only contacts matching your criteria.

    Step 3 — View Individual Subscriber Activity Timelines

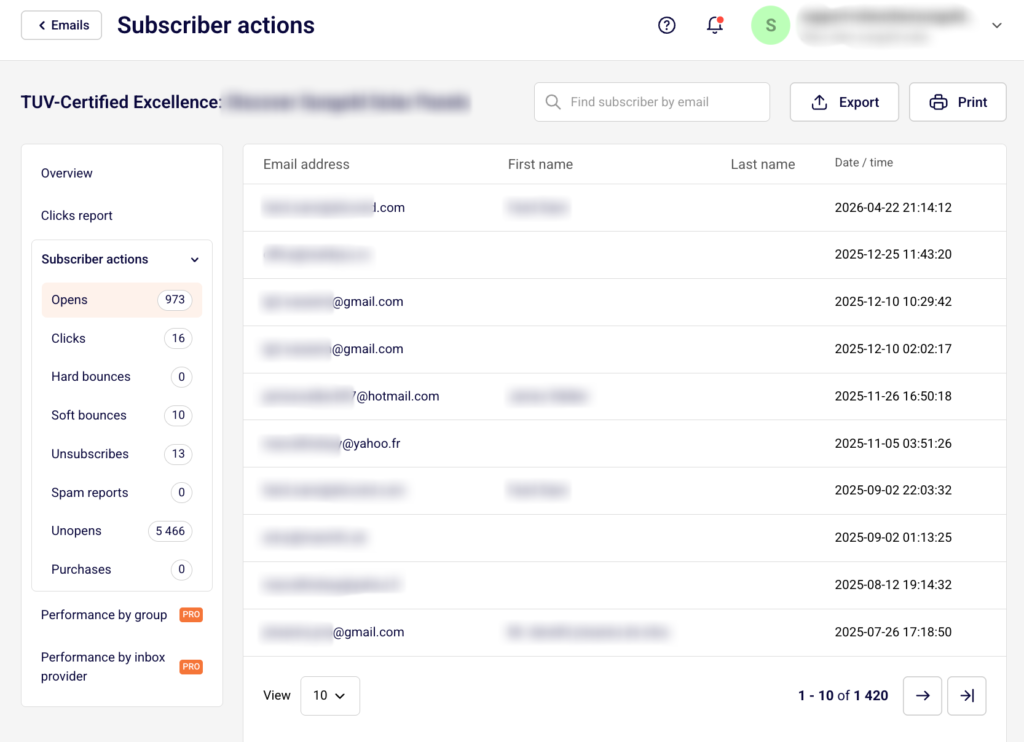
    Click any subscriber in the list to open their Subscriber's profile. The right side of the profile displays the Subscriber activity timeline, showing timestamped entries for events like group additions, email sends, and source data.

    Click the Filter activity dropdown to toggle specific event types: Opens, Clicks, Unsubscribes, Bounces, Spam reports, Emails, Subscriber changes, and Custom events. Each entry includes the date, time, and event details.

    Step 4 — Check Group-Level and Segment-Level Analytics

    Go to Subscribers → Groups to see a table with columns for Active, Total, Unsubscribed, and Bounced subscriber counts per group. This shows the health and composition of each group at a glance.

    Then go to Subscribers → Segments to review pre-built engagement segments like New subscribers, Highly engaged subscribers, Engaged subscribers 180 days, and Unengaged subscribers 180 days, each showing Active subscribers and Total subscribers counts.

    Step 5 — Review Form Conversion Performance

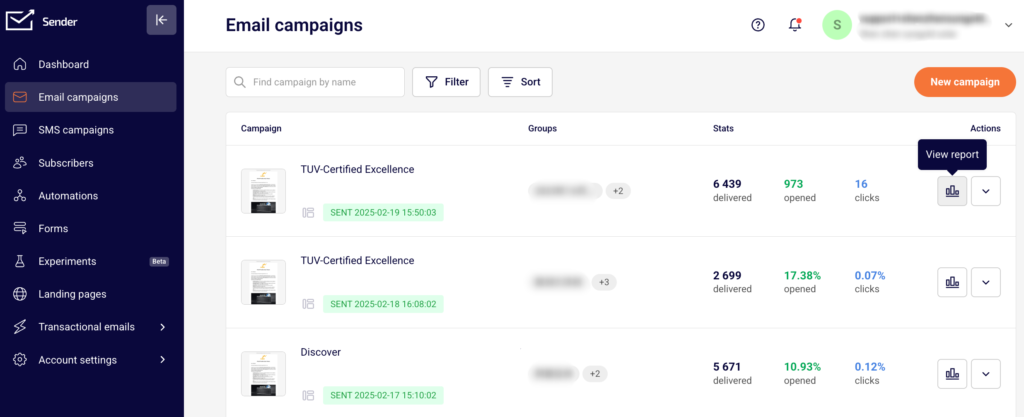
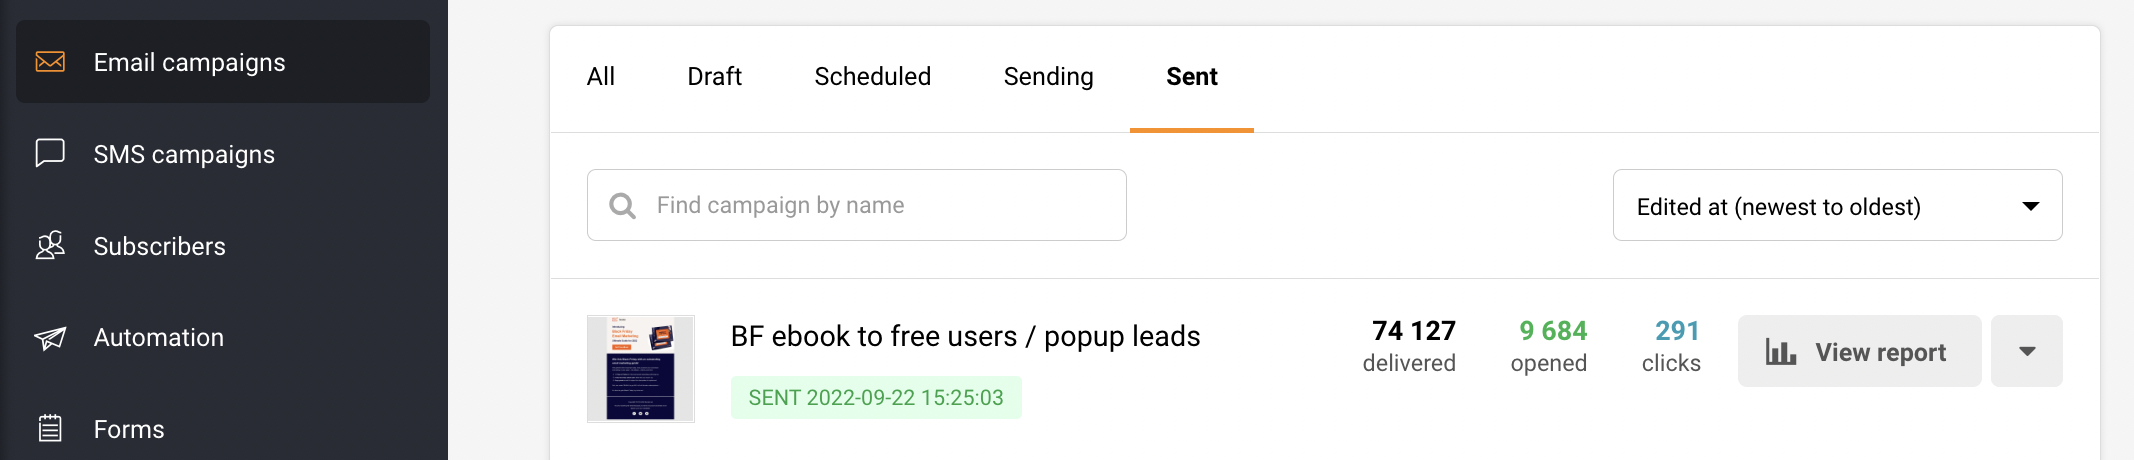
    Go to Forms to view a list of all signup forms. Each form row displays the form name, type (such as Pop-up or Embedded form), status, and last edited date.

    The Stats columns show subscribed (number of subscribers collected), visitors (number of form views), and conversion rate (percentage of visitors who submitted the form). Compare these values across forms to identify which forms drive the most subscriber growth.

    Key Data Points

    Total new subscribers — Displayed in the Subscribers growth panel on the Dashboard. Shows the count of new subscribers added during the selected date range. A trend arrow indicates whether the count has increased or decreased compared to the previous period.

    Total unsubscribers — Shown alongside new subscribers in the Subscribers growth panel. Tracks the number of contacts who opted out during the selected period. Compare this against new subscribers to assess net growth.

    Total bounces — Also in the Subscribers growth panel. Displays the number of bounced contacts for the date range. High values relative to new subscribers may indicate list quality issues.

    Date added — A sortable column on the Subscribers list page. Shows when each subscriber was added to the account. Click the column header to sort by newest or oldest contacts.

    Subscriber activity timeline — Found on the Subscriber's profile page. Displays a chronological log of all interactions including group additions, email events, and source information. Filterable by event type using the Filter activity dropdown.

    Group subscriber counts — Shown on the Groups page under Subscribers. Columns include Active, Total, Unsubscribed, and Bounced for each group, providing a breakdown of list composition per group.

    Segment subscriber counts — Shown on the Segments page. Each segment displays Active subscribers and Total subscribers, allowing you to monitor the size of engagement-based segments over time.

    Form conversion rate — Displayed in the Stats column on the Forms page. Calculated as subscribed divided by visitors. A value of 0.00% indicates no submissions relative to views.

    How to Use This Data

    Identify inactive subscribers for list cleanup — Go to Subscribers → Subscribers and open the Advanced filter. Under Campaign activity, select Was inactive to find subscribers with no recent engagement. Use this filtered list to target a re-engagement campaign or remove contacts that have not interacted over a sustained period.

    Monitor net subscriber growth over time — On the Dashboard, compare Total new subscribers against Total unsubscribers in the Subscribers growth panel across different date ranges. Switch between Last 7 days, Last 30 days, and Last 12 months to identify growth trends or periods of increased churn.

    Compare form performance — On the Forms page, review the subscribed, visitors, and conversion columns for each form. Forms with high visitor counts but low conversion rates may need design or targeting adjustments. Forms with the highest subscriber counts are your strongest growth drivers.

    Segment by engagement level — Go to Subscribers → Segments and review the pre-built segments Highly engaged subscribers and Unengaged subscribers 180 days. Use these segments to target active contacts with priority content or to isolate disengaged subscribers for re-engagement workflows.

    Track group health — On the Groups page, review the Active, Unsubscribed, and Bounced columns for each group. Groups with a high ratio of unsubscribed or bounced contacts relative to the total may need attention or cleanup.

    Audit individual subscriber engagement — Open any subscriber's profile and review the Subscriber activity timeline. Filter by Opens or Clicks to see how recently and frequently the subscriber has interacted with your campaigns.

    Common Issues

    Subscribers growth panel shows zero values → This happens when no subscriber changes occurred during the selected date range. Adjust the date range using the selector in the top-right corner of the Dashboard, or try a broader range like Last 30 days or Last 12 months.

    Advanced filter returns no results → The filter conditions may be too restrictive or referencing a campaign with no matching activity. Remove one or more conditions and re-apply. Confirm that the selected campaign or activity type has data within the expected time frame.

    Subscriber activity timeline appears empty → The contact may have been recently imported with no campaign interactions yet. Check the Filter activity dropdown to ensure all relevant event types are enabled. If only Subscriber changes is toggled on, you will only see group additions and profile updates.

    Form conversion rate shows 0.00% → The form may be in Draft status and has not been published or embedded on a live page. Verify the form status on the Forms page and ensure it is active and receiving visitor traffic.

    Group counts don't match subscriber list totals → Subscribers can belong to multiple groups, so summing group totals may exceed the overall subscriber count. The Groups page reflects per-group membership, not deduplicated totals.

    FAQs

    How do I see how many subscribers signed up through a specific form?

    Go to Forms. Each form displays its subscribed count in the Stats column. This shows the total number of subscribers collected through that form.

    Can I track subscriber growth over time?

    Go to the Dashboard and scroll to the Subscribers growth panel. It displays Total new subscribers, Total unsubscribers, and Total bounces over your selected date range. Use the date range selector to adjust the period and the Show data for dropdown to filter by group.

    How do I find my least engaged subscribers?

    Go to Subscribers → Subscribers and click Advanced filter. Under Campaign activity, select Was inactive and set the relevant time frame. Alternatively, go to Subscribers → Segments and review the Unengaged subscribers 180 days segment.

    Does Sender show a conversion rate for signup forms?

    Yes. Go to the Forms page. Each form row displays a conversion percentage in the Stats column, calculated as subscribed divided by visitors.

    Can I export subscriber data?

    On the Dashboard, click the Export button in the top-right corner to export overview data. On the Subscribers list page, use the Actions dropdown for subscriber-level export options. For engagement-level data like opens and clicks, check the individual subscriber profile's Subscriber activity timeline.

    How do I filter the subscriber activity timeline by event type?

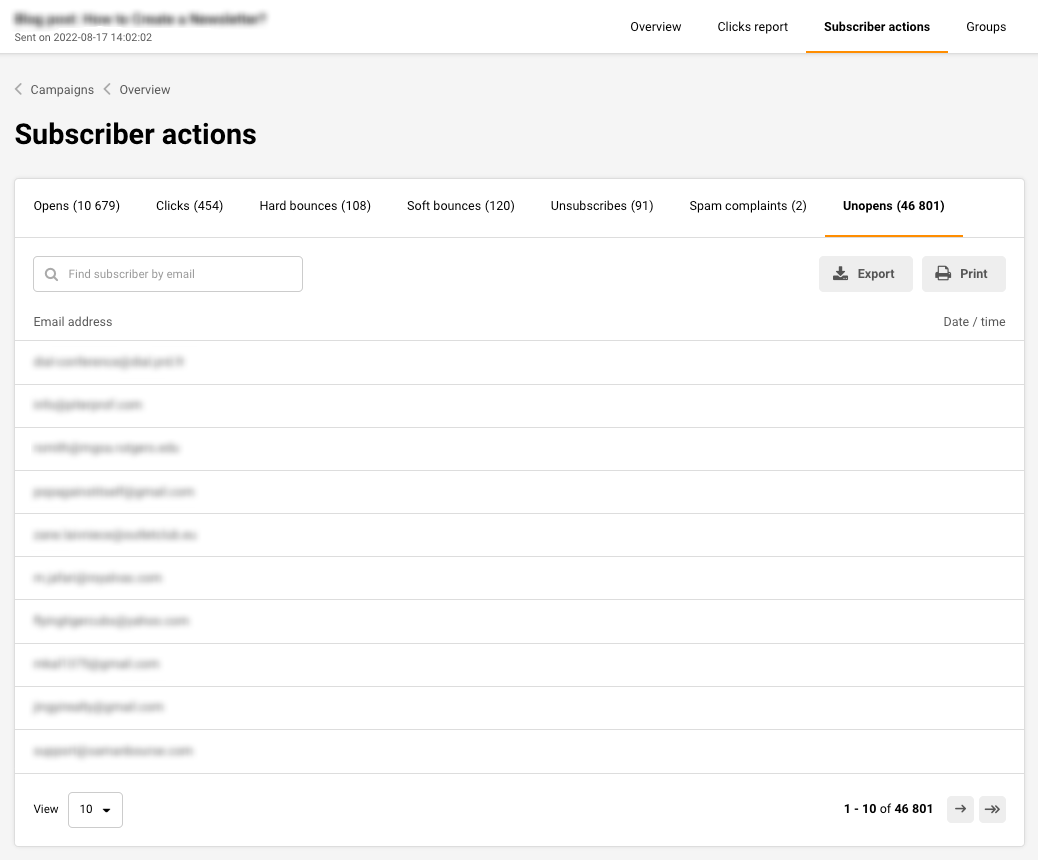
    Open a subscriber's profile by clicking their name on the Subscribers list page. On the Subscriber activity panel, click Filter activity and toggle the event types you want to view: Opens, Clicks, Unsubscribes, Bounces, Spam reports, Emails, Subscriber changes, or Custom events.

    What pre-built segments are available for engagement tracking?

    Go to Subscribers → Segments. Sender provides pre-built segments including New subscribers, Highly engaged subscribers, Engaged subscribers 180 days, and Unengaged subscribers 180 days. Each segment shows Active subscribers and Total subscribers counts.

  • Form analytics and conversion rates

    This guide explains how to view form submission stats, track visitor-to-subscriber conversion rates, and analyze individual form performance in Sender.

    Where to Find This Data

    Form analytics are accessible from two locations in Sender.

    The Forms list page displays summary stats for every form in your account. Each form row shows the subscribed count, visitors count, and conversion percentage, giving you a side-by-side comparison across all forms.

    For detailed analytics on a specific form, open that form's Overview page. The Overview includes an Activity summary panel with total signups, total views, and conversion rate, a Daily visitors / signups chart, and a Subscribers table listing every contact who signed up through that form.

    Steps to Access and Analyze Form Data

    Step 1 — Review form stats on the Forms list page

    Go to Forms in the left sidebar. The list page displays all your forms with a Stats column. Each form shows three values: subscribed (total signups), visitors (total form views), and conversion (percentage of visitors who subscribed). Use the Filter dropdown above the list to narrow results by form type — Embedded forms, Pop-ups, or Spin-to-win forms. Use the Sort dropdown to reorder forms by Name, Edited at, or Created at.

    Step 2 — Open a form's Overview for detailed analytics

    Click the dropdown arrow in the Actions column for any form and select Overview. The Overview page displays an Activity summary panel at the top right with total signups, total views, and conversion rate. Below the summary, the Daily visitors / signups chart plots SIGNUPS and VISITORS over time, letting you track daily form activity trends.

    Step 3 — View and export form subscribers

    Scroll down on the Overview page to the Subscribers section. This table lists every subscriber who signed up through the form, with columns for Email address, First Name, Last Name, and Date / time. Use the Find by email search box to locate a specific subscriber. Set a date range with the Starting date – Ending date picker to narrow results to a specific period. Click Export CSV or Export XLSX to download the subscriber list for that form.

    Step 4 — Compare performance across forms

    Return to the Forms list page by clicking < Forms at the top of the Overview page. Compare the subscribed, visitors, and conversion values side by side across all forms. Use Filter to isolate a specific form type and Sort to order forms by creation or edit date for chronological comparison.

    Key Data Points

    Subscribed — The total number of subscribers who signed up through a specific form. Displayed in the Stats column on the Forms list page and as total signups on the form Overview page.

    Visitors — The total number of times a form was viewed. Shown as visitors on the Forms list page and as total views on the form Overview page. A high visitor count with low signups suggests the form may need optimization.

    Conversion rate — The percentage of form visitors who completed a signup. Displayed as conversion on the Forms list page and as conversion rate on the form Overview page. Calculated as total signups divided by total views.

    Daily visitors / signups chart — A time-series chart on the form Overview page that plots daily SIGNUPS and VISITORS separately. Available only on the individual form Overview, not on the list page.

    Subscriber Date / time — The timestamp when each subscriber signed up through the form. Displayed in the Subscribers table on the form Overview page. Useful for identifying signup patterns and peak activity periods.

    How to Use This Data

    Compare form conversion rates — Review the conversion column on the Forms list page to identify which forms convert visitors at the highest and lowest rates. Use Filter to compare performance within the same form type, such as all pop-ups or all embedded forms.

    Track signup trends over time — Open a form's Overview and review the Daily visitors / signups chart to spot trends in form traffic and signups. Date-level visibility helps you correlate spikes or dips with campaigns, promotions, or website changes.

    Identify your highest-performing form — Sort the Forms list by edit or creation date and compare the subscribed and conversion values across all forms to determine which form drives the most subscriber growth.

    Export form subscribers for segmentation — Use the Export CSV or Export XLSX buttons on a form's Overview page to download a list of subscribers who signed up through that specific form. This data can support group creation or targeted follow-up campaigns.

    Filter form subscribers by date — On the form Overview page, use the Starting date – Ending date picker in the Subscribers section to isolate signups from a specific time window, such as a campaign launch period or a seasonal promotion.

    Common Issues

    Conversion rate shows 0.00% → The form has not received any visitor views or signups yet. Verify the form is published and the tracking script is installed on your website. Draft forms do not collect visitor or signup data.

    Visitor count is 0 but form is published → The form's JavaScript snippet or embed code may not be properly installed on your website. Check the Publishing settings page for the form and verify the code is placed correctly on your site.

    Subscriber does not appear in form's subscriber list → The subscriber may have signed up outside the date range set in the Starting date – Ending date picker. Clear the date filter or expand the range to include all time periods. Also confirm the subscriber completed the form submission rather than being added through import or another source.

    Cannot find a specific form in the list → Use the Find form by name search box at the top of the Forms list page. If the form was recently created, check the Sort setting — it may be sorted by edit date rather than creation date.

    Export buttons are not generating a file → The Subscribers table on the form Overview page may be empty. If there are no signups for the selected form or date range, the export will not produce data. Adjust the date range or confirm the form has collected subscribers.

    FAQs

    How do I see how many subscribers signed up through a specific form?

    Go to Forms in the left sidebar. Each form displays its subscribed count in the Stats column. For more detail, click the dropdown arrow next to the form and select Overview to see the Activity summary with total signups.

    Does Sender show a conversion rate for signup forms?

    Yes. The Forms list page shows a conversion percentage for each form. The form Overview page displays the conversion rate in the Activity summary panel, calculated as total signups divided by total views.

    Can I compare performance across different forms?

    Yes. The Forms list page shows subscribed, visitors, and conversion side by side for every form. Use Filter to narrow by form type (Pop-ups, Embedded forms, Spin-to-win forms) and Sort to reorder the list for easier comparison.

    Can I see which subscribers signed up through a specific form?

    Open the form's Overview page by selecting Overview from the form's dropdown menu. Scroll down to the Subscribers section, which lists every subscriber with their Email address, First Name, Last Name, and Date / time of signup.

    Can I export the list of subscribers from a single form?

    Yes. On the form's Overview page, scroll to the Subscribers section and click Export CSV or Export XLSX. You can also set a date range using the Starting date – Ending date picker before exporting to limit the data to a specific period.

    Why is my form's visitor count not updating?

    Visitor tracking requires the form to be published and the tracking script to be installed on your website. Check the form's Publishing settings page to confirm the JavaScript snippet is in place. Draft forms do not track visitors.

  • See non-openers list

    Of course, the easiest way to do that is by going to the Campaigns section and clicking on the “View Reports’ button. Then you will be taken to the reports section, next click on “Subscriber actions” and select the “Unopened” tab.

    From here on you will be able to export, view/edit individual subscribers who did not open this particular campaign.

    That’s it!

    If you got stuck on a specific task or can’t find a way to execute a particular job, contact our support team via LiveChat or [email protected] – we’re here to help 24/7.

  • Analyze subscriber actions

    Subscribers Actions

    The subscriber’s activity section summarizes campaign performance, e.g., like how many recipients have opened it, how many recipients received the campaign, how many of them clicked on a particular link, how many unsubscribed, and etc.

    Let’s start by going to Email campaigns and clicking the reports icon next to the campaign in question.

    Subscriber actions overview contains multiple tabs:

    • Opens
    • Clicks (recipients that clicked on a link)
    • Hard-bounces (failed deliveries due to invalid email address)
    • Soft-bounces
    • Unsubscribes
    • Spam complaints
    • Unopened
    • Purchases

    The report section has selectable tabs – if you click on any of them, the individual report will display. For example, if you click on the “opened” tab – you will be presented with recipients that opened the campaign.

    Furthermore, listed recipients can be exported if needed.


    If you got stuck on a specific task or can’t find a way to execute a particular job, contact our support team via LiveChat or [email protected] – we’re here to help 24/7.

  • View click report

    Click report section

    The click report shows newsletters click activity – heatmap. You will be able to see where subscribers clicked the most. Newsletters links are tracked and recorded to the report section – from here you will be able to gather required data and execute wanted actions.

    Let’s start by opening dashboard and clicking on campaign > view reports section.

    When a report section is opened – click on “Click report” to open a report. Next, you will see a body of the newsletter and small percent tags next to placed links. 

    When the percent tag is clicked – a new tab will open. Here you will find subscribers who clicked on the link.  By clicking on an individual recipient, you will access its records, basically prior actions (received campaigns, opened, clicked). Furthermore, you can assign these recipients to a group by clicking “Add group” button.  


    If you got stuck on a specific task or can’t find a way to execute a particular job, contact our support team via LiveChat or [email protected] – we’re here to help 24/7.